Figures & data
FIGURE 1. A 2011 LiDAR Digital Elevation Model of study site near Prudhoe Bay in northern Alaska with the ground penetrating radar (GPR) transects indicated as red and blue dots. White regions indicate missing LiDAR data. Label A indicates a wet depression, B is a dry hummock, with subsurface ice, C is the access road for the Trans-Alaska pipeline, and D is a spillover for flood prevention. Green and white stars indicate starting and ending points of the sample GPR image depicted in , part a. The two layer stratigraphy (blue dots) only occurs in topographic depressions.
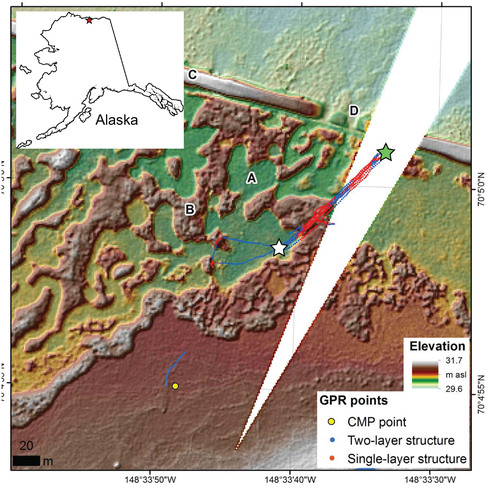
FIGURE 2. (a) The 500 MHz Common Mid Point gather and (b) coherence plot at our study site. The CMP gather (a) shows two coherent hyperbolic reflections: L1 (red) corresponds to the transition from peat to silt and L2 (green) corresponds to the permafrost table. Peaks in the coherence plot (crosses in b), allow normal-move-out velocity determination (Equation 1).
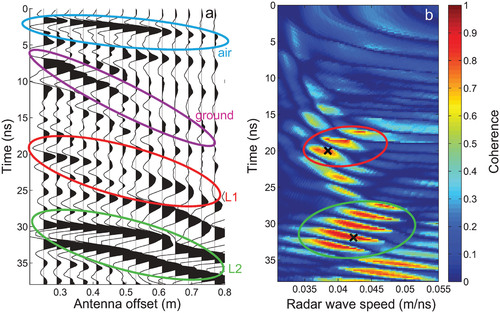
FIGURE 3. (a) An example of 500 MHz radar data acquired at our study site showing the two-way travel time (twtt) of the radar reflections as a function of distance. A two layer structure is visible at 5, 40, and 90 m on the profile. The stars indicate the start and end points shown in . (b) Details of the radar stratigraphy in regions (18 m to 68 m along the profile) with a two-layer structure. The green line is the base of the peat layer; the red line is the silt-permafrost boundary.
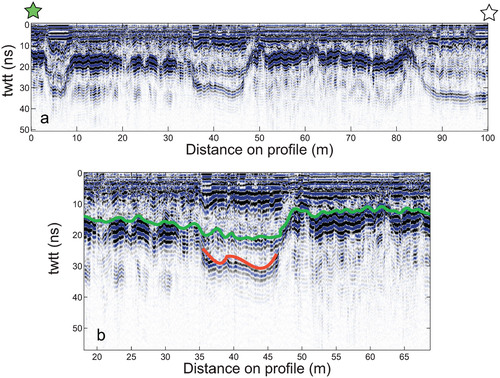
FIGURE 4. Comparison of thaw depth results between GPR (black line) and probing (circles) along one transect. The red line indicates organic layer thickness measured with the GPR. The radar speed of 0.045 m ns-1, measured with the CMP, was used to convert GPR travel time into thaw depth estimates.
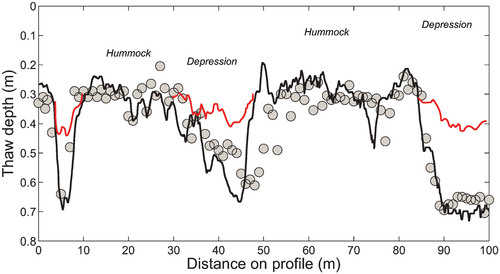
FIGURE 5. Photographs of the study area with variable active layer and permafrost conditions. (a) Researchers pulling the GPR unit over a test pit on a hummock. (b) Researchers recording vegetation conditions along the survey line showing approximate distances corresponding to hummocks and depressions in and . (c) A test pit on a hummock showing an ∼30 cm organic layer on top of ice. (d) A test pit in a depression showing a 30 cm organic layer on top of fine gray silt.
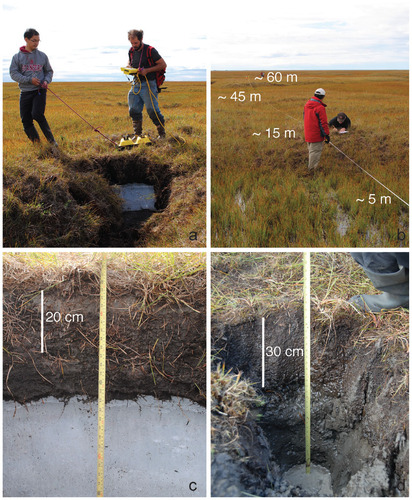
FIGURE 6. Historical satellite and aerial images indicate the site was stable until 1979. The 1988 SPOT image suggests that thermokarst development began between 1979 and 1988 and clearly expanded between 1988 and 2006. The drainage at the site originally was from lower left (SW) to upper right (NE) in the image, and the small access road built in the mid 1970s blocked this natural drainage.
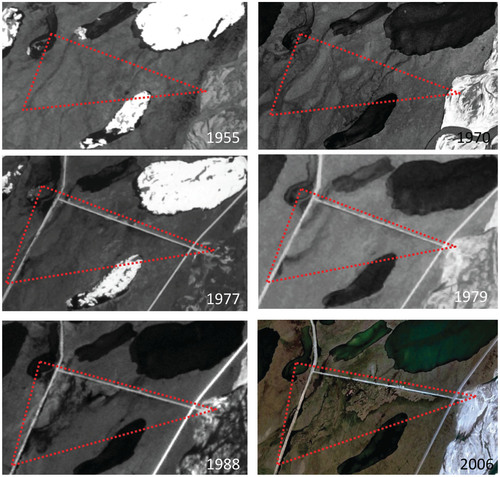
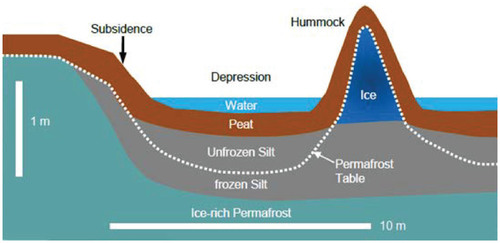
FIGURE 7. Schematic of subsurface structure at the study site. The thawing of ice-rich permafrost at the site produces large-scale subsidence, resulting in a series of depressions filled with water and small hummocks heaved up by ice. The secondary reflection detected in the depressions by the GPR is the boundary between the peat and the underlying silt.