Figures & data
(A) The effect of arsenic trioxide [As2O3], (B) cobalt chloride [CoCl2] and (C) curcumin on the cell growth and viability of the human breast cancer MCF-7 cells. All the three compounds inhibited viability of MCF-7 cells in vitro when compared with the untreated control cells. Results were obtained from three independent experiments and were presented as ± standard error of the mean and the differences were considered significant when **p ≤ 0.01 and ***p ≤ 0.0001.
![Figure 1. Cell viability analysis of the effect of arsenic trioxide, cobalt chloride and curcumin on MCF-7 cells.(A) The effect of arsenic trioxide [As2O3], (B) cobalt chloride [CoCl2] and (C) curcumin on the cell growth and viability of the human breast cancer MCF-7 cells. All the three compounds inhibited viability of MCF-7 cells in vitro when compared with the untreated control cells. Results were obtained from three independent experiments and were presented as ± standard error of the mean and the differences were considered significant when **p ≤ 0.01 and ***p ≤ 0.0001.](/cms/asset/b2132032-6b2a-43c1-bf2e-889d07a6ba1c/ifso_a_12364209_f0001.jpg)
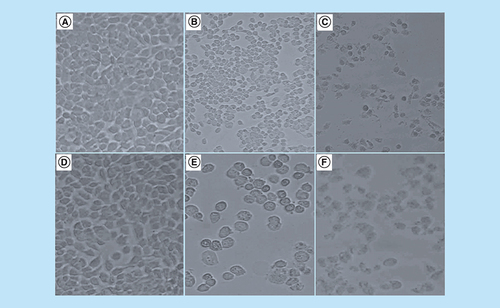
Morphological characteristics of MCF-7 cells after the treatment for 24 h with (2B) 11 μM and (2E) 32 μM arsenic trioxide, (2C) 100 μM cobalt chloride and (2F) 100 μM curcumin as compared with (2A & 2D) untreated cells.
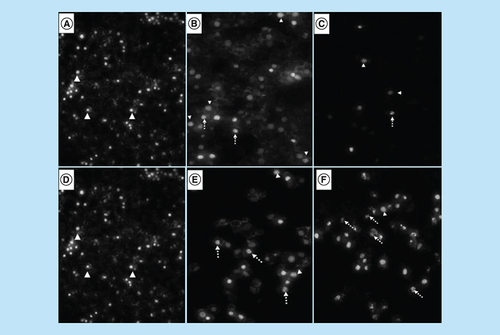
Analysis of morphological effects of the cell cycle and apoptosis inducers, arsenic trioxide, cobalt chloride and curcumin on MCF-7 cells. DAPI staining showed an increase in the mitotic cells (white unbroken arrow) and the apoptotic cells (white dotted arrow) after (B & E) arsenic trioxide, (C) cobalt chloride and (F) curcumin treatments compared with untreated cells (3A and D with white arrow heads).
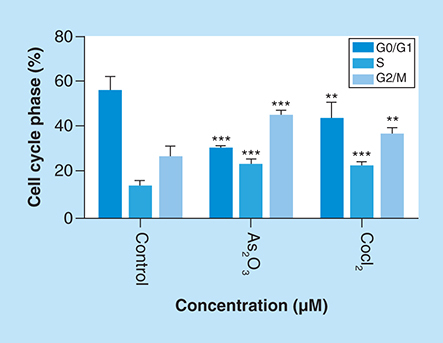
Distribution of MCF-7 cells at distinct cell cycle phases after the treatment with (4B) arsenic trioxide and (4C) cobalt chloride compared with the untreated cells. Treatment with 11 μM arsenic trioxide and 100 μM of cobalt chloride (positive control) resulted with increased G2/M cell cycle arrest in MCF-7 cells when compared with (4A) the untreated control.
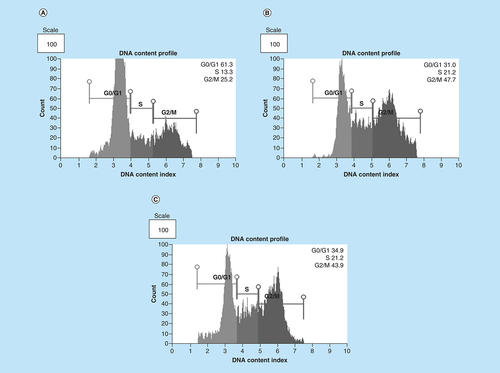
Arsenic trioxide (11 μM) and cobalt chloride (100 μM) induced G2/M arrest relative to the untreated MCF-7 cells. Results were obtained from three independent experiments and were presented as ± SEM and the differences were considered significant when *p was ≤ 0.05, **p ≤ 0.01 and ***p ≤ 0.0001.
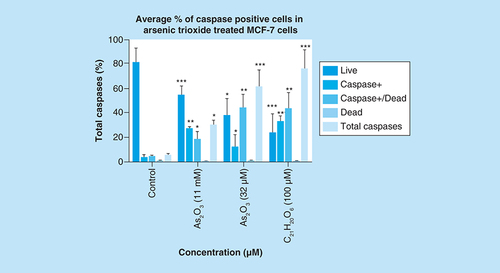
Caspase induction by arsenic trioxide and curcumin in MCF-7 cells. The MUSE® Multi-capsase Analysis confirmed that treatment with 11 and 32 μM of (B & C) arsenic trioxide and 100 μM of the positive control, (D) curcumin induced caspase-dependent mode of death in MCF-7 cells when compared with (A) the untreated control.
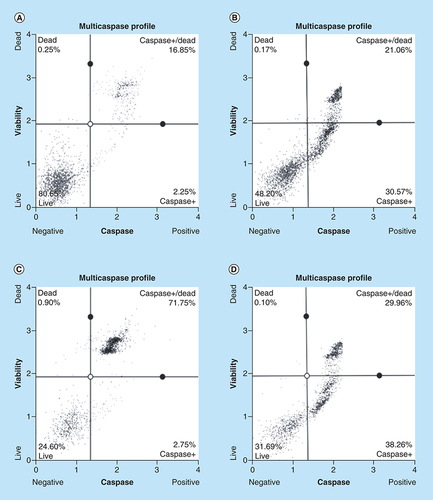
Treatment with arsenic trioxide (11 and 32 μM) and curcumin (100 μM) for 24 h induced caspase-dependent mode of death in MCF-7 cells relative to the untreated control. Results were obtained from three independent experiments and were presented as ± standard error of the mean and the differences were considered significant when *p was ≤ 0.05, **p ≤ 0.01 and ***p ≤ 0.0001.
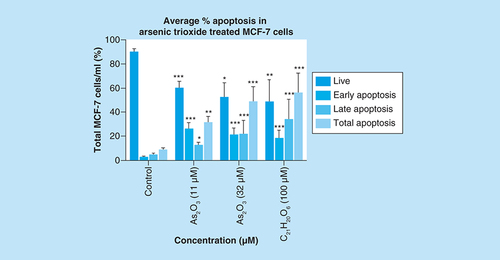
Apoptosis induction by arsenic trioxide and curcumin in MCF-7 cells. The MUSE® Apoptosis Analysis confirmed that treatment with 11 and 32 μM of (B & C) arsenic trioxide and 100 μM of the positive control, (D) curcumin induced apoptosis in MCF-7 cells when compared with (A) the untreated control.
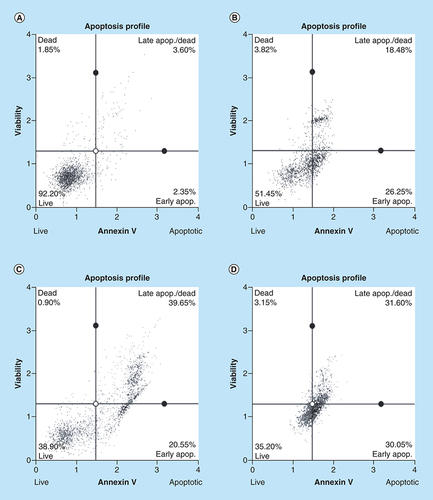
Treatment with arsenic trioxide (11 and 32 μM) and curcumin (100 μM) for 24 h induced apoptosis mode of death in MCF-7 cells relative to the untreated control. Results were obtained from three independent experiments and were presented as ± standard error of the mean and the differences were considered significant when *p was ≤ 0.05, **p ≤ 0.01 and ***p ≤ 0.0001.
Amplification of RBBP6 variants in MCF-7 cells and Hek-293 cells. The primers were designed both upstream and downstream the exon 16 region to amplify both variants 1 and 2. The results (A) show untreated MCF-7 cells (lane 1) expressing variant 1, treatment with 11 μM of As2O3 (lane 2), treatment with 32 μM of As2O3 (lane 3), treatment with 100 μM cobalt chloride (lane 4) and at last treatment with 100 μM curcumin (lane 5), all showing repressed expression of variant 1. (B) (Lanes 1–5) represent GAPDH that was used as a loading control. Lanes M stand for the molecular weight marker while lanes BL were blank controls. (C) (Lanes 1–3) show the expression of both variants 1 and 2 by the untreated Hek 293 cells.
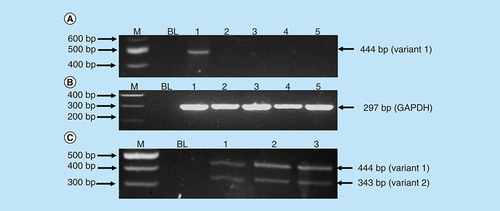
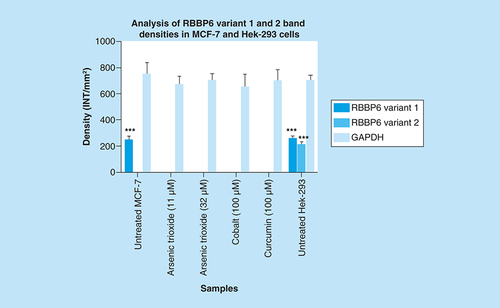
Untreated MCF-7 cells significantly (***p ≤ 0.001) show increased band intensity of the RBBP6 variant 1 which diminished after treatment with arsenic trioxide, cobalt chloride and curcumin. Untreated MCF-7 cells did not show any expression of RBBP6 variant 2, with only untreated Hek-293 cells showing detectable levels of both RBBP6 variants 1 and 2. Results were obtained from three independent experiments and were presented as ± standard error of the mean and the differences were considered significant when ***p < 0.001. The density was measured using Quanty‐One software.
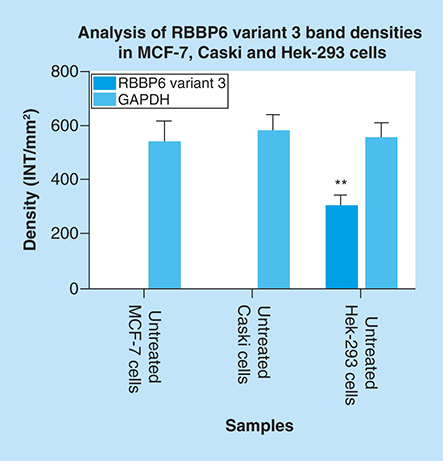
Amplification of RBBP6 variant 3 in MCF-7 cells, Caski cells and Hek 293 cells. The result (A) shows untreated MCF-7 cells (lane 1) and untreated Caski cells (lane 2) both with an undetectable expression of RBBP6 variant 3, only untreated Hek 293 cells (lane 3) show the expression of RBBP6 variant 3. (B) (Lanes 1–3) represent GAPDH that was used as a loading control. Lanes M stand for the molecular weight marker while lanes BL were blank controls.
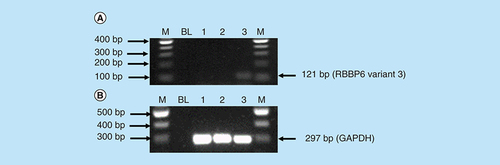
Both untreated MCF-7 and Caski cells had undetectable expression of RBBP6 variant 3, only untreated Hek-293 cells show detectable levels of RBBP6 variant 3. Results were obtained from three independent experiments and were presented as ± standard error of the mean and the differences were considered significant when **p ≤ 0.001 The density was measured using Quanty‐One software.
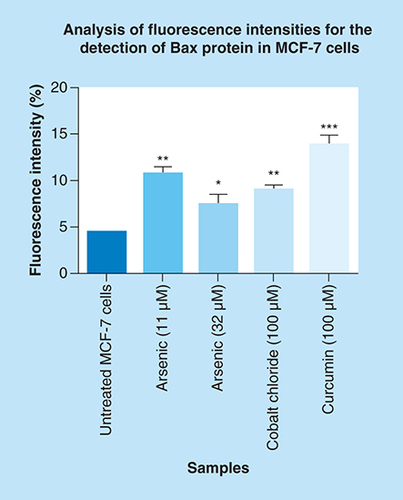
Localization and expression of Bax in MCF-7 cells counterstained with DAPI. The results show (A & B) a negative control, no labeling is seen. (C–L) Micrographs show positive Bax staining in the nucleus and cytoplasm. MCF-7 cells show less expression of Bax in (C & D) untreated cells because apoptosis is inhibited in these cells, but the treatment with (E–H) arsenic trioxide upregulated the expression of this protein. The same trend was observed even in the positive controls, (I & J) cobalt chloride and (K & L) curcumin which also regulated the expression of Bax protein. White arrows point to mitotic cells with increased Bax staining levels. Magnification 20×.
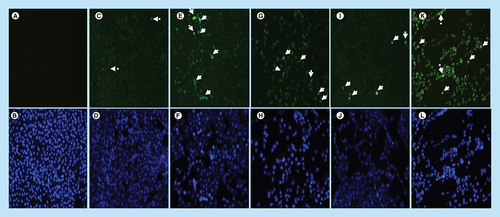
Arsenic trioxide upregulated the expression of Bax protein when compared with the untreated control. The same trend was observed even with the positive controls (cobalt chloride and curcumin). Results were obtained from three independent experiments and were presented as ± standard error of the mean and the differences were considered significant when *p was ≤ 0.05, **p ≤ 0.01 and ***p ≤ 0.0001. The fluorescence intensity was measured using the Image J software (https://imagej.nih.gov/ij/docs/index.html).