
Figures & data
Table 1. Number and direction of the change of differentially expressed mRNA and lncRNA in African ancestry and European ancestry.
(B) lncRNAs in AA and EA.
AA: African ancestry; EA: European Ancestry.
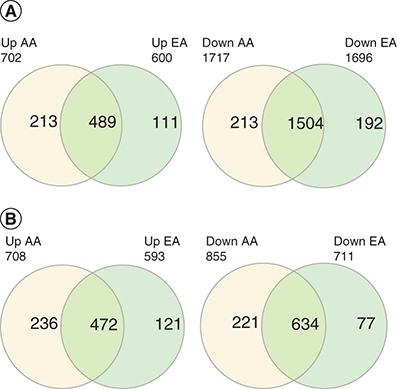
Table 2. mRNAs and lncRNAs differentially expressed between prostate cancer samples from patients of African ancestry and European ancestry.
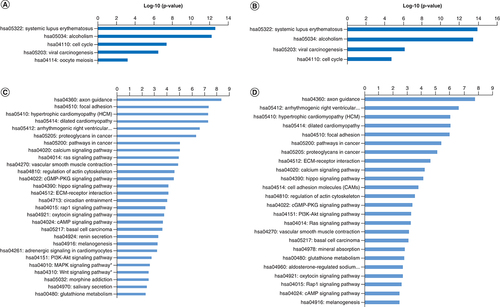
(A) Enriched KEGG pathways for upregulated genes in AA. (B) Enriched KEGG pathways for upregulated genes in EA. (C) Enriched KEGG pathways for downregulated genes in AA (MAPK and WNT pathways). (D) Enriched KEGG pathways for upregulated genes in EA.
AA: African ancestry; EA: European Ancestry; KEGG: Kyoto Encyclopedia of Genes and Genomes.
lncRNA are marked in red and mRNA are marked in blue. Four networks with more than eight nodes of co-expressed genes are shown, one network co-expressed three lncRNA and another network co-expressed two lncRNA. Two tightly connected networks of the same family of genes (Protocadherin Alpha and TBC1 domain family member and 3 [TBC1D3]). In the quintet network one lncRNA was co-expressed. One quartets network was with only lncRNA co-expressed. Among the five trios networks, two had two lncRNA co-expressed and the other only one. Small networks with fewer than two nodes are not shown.
![Figure 3. Co-expression network of DE mRNA and lncRNA in African ancestry tumor samples.lncRNA are marked in red and mRNA are marked in blue. Four networks with more than eight nodes of co-expressed genes are shown, one network co-expressed three lncRNA and another network co-expressed two lncRNA. Two tightly connected networks of the same family of genes (Protocadherin Alpha and TBC1 domain family member and 3 [TBC1D3]). In the quintet network one lncRNA was co-expressed. One quartets network was with only lncRNA co-expressed. Among the five trios networks, two had two lncRNA co-expressed and the other only one. Small networks with fewer than two nodes are not shown.](/cms/asset/1c2749b6-83e6-4096-8595-834827d0dff0/ifso_a_12364441_f0003.jpg)
lncRNA are marked in red and mRNA are marked in blue. One network co-expressed three lncRNA and three network co-expressed one lncRNA. Most of the small networks with fewer than two nodes are not shown.
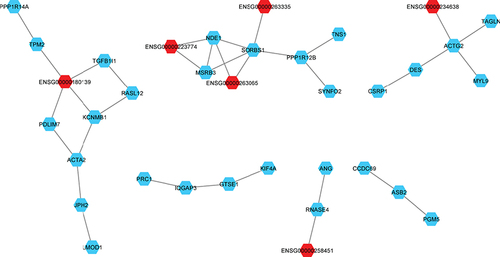
Table 3. lncRNAs and mRNAs coexpressed in African ancestry.
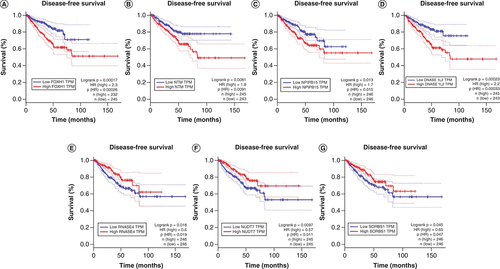
The X and Y axes represent survival time (months) and disease-free survival, respectively. The analysis was made in GEPIA.