Figures & data
Table 1 The list of the MD system
Figure 1 Ramachandran plot of MT1–MT3.
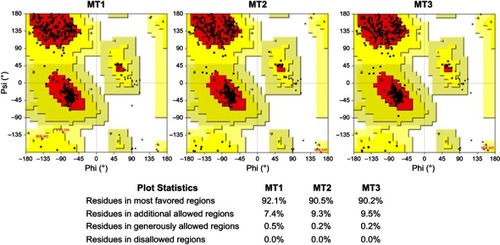
Figure 2 Z-score of template and MT1–MT3.
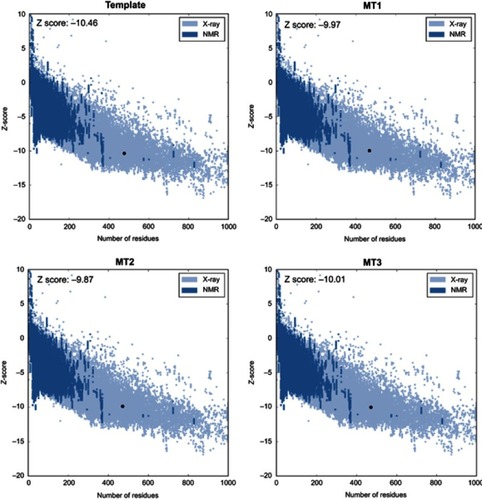
Figure 3 Profile of RMSD throughout 100 ns of simulation. (A) RMSD backbone of the enzyme which presented in 100 frames moving average and (B) RMSD of substrate binding.
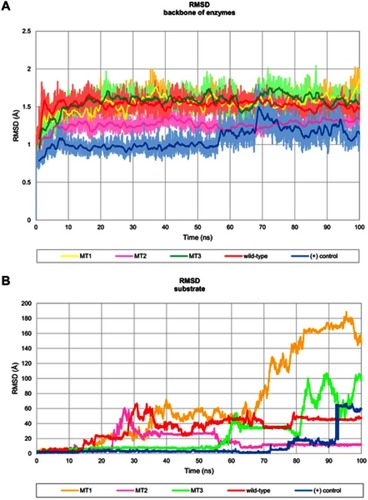
Figure 4 Profile of RMS fluctuation throughout 100 ns of MD simulation.
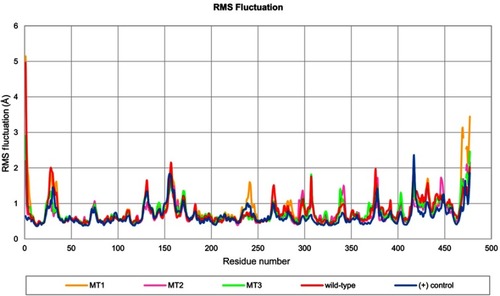
Figure 5 Time evolution snapshot every 20 ns and interaction around the substrate in initial position. (A), (C), and (E) show the substrate position along the simulation and the distance of the substrate from the initial position. (B), (D), and (F) show the interaction that occurred around the substrate. The yellow, pink, and green color show the MT1, MT2, and MT3, respectively. The substrate is visualized in the green stick, and the hydrogen bond in the green dashed line.
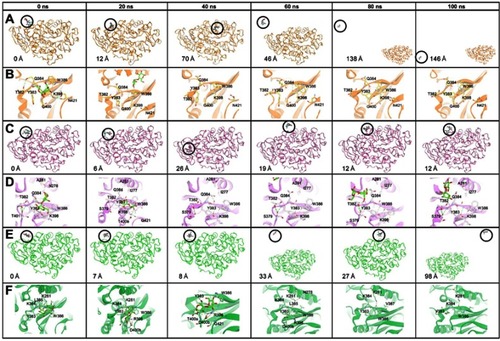
Table 3 Computed binding energy between enzyme and substrate
Figure 6 Pairwise decomposition energy between maltose and side chain of residues around the mutation points in all systems.Residue number according to PDB ID 2GVY.
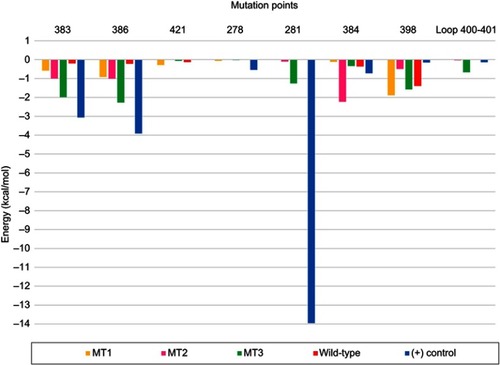
Figure 7 Time evolution snapshot every 20 ns at the two aromatic residues of SBS. (A) positive control, (B) MT1, (C) MT2, and (D) MT3.
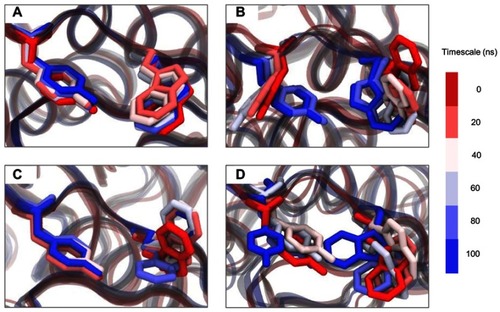
Table 2 Hydrogen bond formation between substrate and enzyme throughout 100 ns of MD simulations
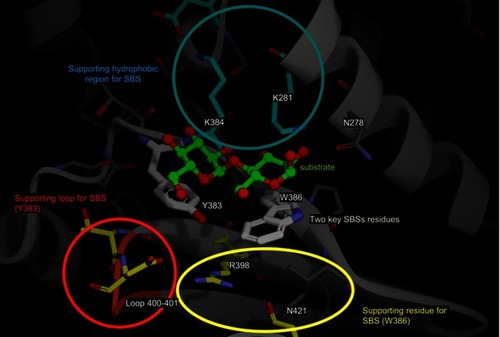
Figure 8 The summary of SBS modification in MT3. The substrate is shown in green, the two key SBSs are shown in gray, and the supporting hydrophobic region, supporting loop, and supporting residues are shown in the blue, red, and yellow circles, respectively.