Figures & data
Figure 1 Network diagram of metabolic pathway of shikimic acid production in Escherichia coli.
Abbreviations: PEP, phosphoenol pyruvate; E4P, erythrose-4-phosphate; DAHP, 3-deoxy-D-arabino-heptulosonate-7-phosphate; DHQ, 3-dehydroquinate; DHS, 3-dehyroshikimate; SKM, shikimate; S3P, shikimate-3-phosphate; EPSP, 5-enolpyruvylshikimate-3-phosphate; CHA, chorismate.
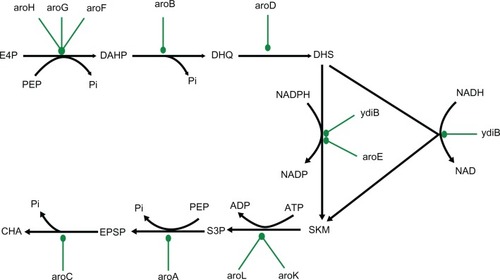
Table 1 Classification of genes as bacteriostatic (growth arrest) and bactericidal (growth arrest and increase in redox ratio)
Figure 2 Effect of different concentrations (250 μM, 500 μM, 1000 μM) of drug (uncompetitive inhibitor) against aroA on biomass in glucose media was estimated through in silico simulation.
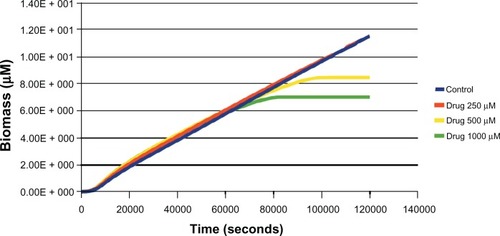
Figure 3 Effect of different concentrations (250 μM, 500 μM, 1000 μM) of drug (uncompetitive inhibitor) against aroA on redox ratio (nicotinamide adenine dinucleotide [NAD]/reduced NAD [NADH]) in glucose media.
![Figure 3 Effect of different concentrations (250 μM, 500 μM, 1000 μM) of drug (uncompetitive inhibitor) against aroA on redox ratio (nicotinamide adenine dinucleotide [NAD]/reduced NAD [NADH]) in glucose media.](/cms/asset/59c7e748-98e6-4372-b1e9-c7a83134cdd5/daab_a_39198_f0003_c.jpg)
Table 2 Graded knockdown data of shikimate pathway genes in glucose media and impact on growth
Figure 4 Effect of various inhibitors (uncompetitive, noncompetitive, competitive) on growth rate of Escherichia coli; uncompetitive inhibitor arrest growth at lower concentrations followed by noncompetitive and competitive inhibitors.
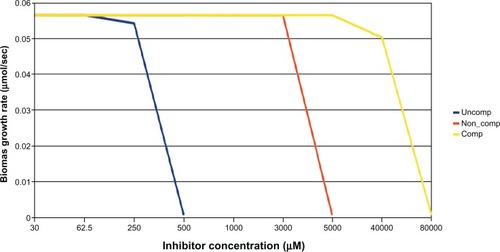
Table 3 Targets from shikimate pathway: relationship between MIC, flux, and the type of inhibition
Figure 5 Determination of Km of shikimate-3-phosphate (S3P) and phosphoenolpyruvate (PEP) for Mycobacterium tuberculosis 5-enolpyruvylshikimate-3-phosphate synthase (EPSPS). Kinetic parameters of Mtu EPSPS determined at a concentration of one substrate and variable concentrations of the other. (A) Apparent Km for PEP was determined to be 104 μM (○–○); (B) apparent Km for S3P was determined to be 16 μM (•–•).
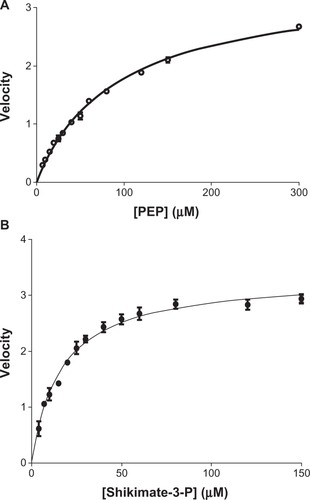
Figure 6 (A and B) IC50 determination. (A) Inhibition of Mycobacterium tuberculosis 5-enolpyruvylshikimate-3-phosphate synthase (EPSPS) by glyphosate. M. tuberculosis EPSPS was assayed in the presence of increasing concentrations of glyphosate. Data points (○–○) indicate mean of triplicate measurements. Analysis was done using GraphPad Prism software. The IC50 of glyphosate for the Mtu EPSPS was found to be 260 μM. (B) Inhibition of Escherichia coli EPSPS by glyphosate. E. coli EPSPS was assayed in the presence of increasing concentration of glyphosate. Data points (•–•) indicate mean of triplicate measurements. Analysis was done using GraphPad Prism software. The IC50 of glyphosate for E. coli EPSPS was found to be 3 μM.
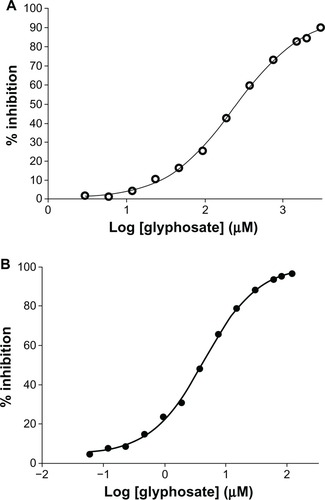
Table 4 MIC of glyphosate in Escherichia coli K-12
Table 5 MBC of glyphosate for Escherichia coli K-12 estimated under different growth conditions
Table 6 Relationship between inhibition type and kinetic parameters
Table S1 Comparison of predicted flux distribution trends for pgi gene knockout mutant with reported experimental trends obtained using glucose as the sole carbon source
Table S2 Comparison of experimental and in silico result in case of ppc knockout mutant
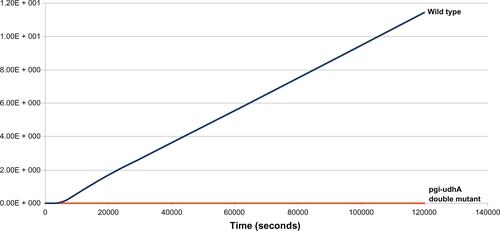
Table S3 Growth rate in wild-type and pgi–udhA double knockoutCitation30
Figure S1 Effect of double knockout (pgi–udhA) on biomass levels and growth rates.
Notes: From the plot, growth rates (slope of the lines) of wild-type E. coli strain and pgi–udhA double-mutant strain can be compared. Simulation results show steady-state attainment of biomass in pgi–udhA double-mutant strain, which is indicative of growth arrest.