Figures & data

Table 1 Binding Affinity and Interaction of 18 Flavonoids with Amino Acids in ACE2 Receptor
Figure 1 Comparative ΔGMMGBSA profiles for compounds 310 and 471 every 10 ns over 100 ns simulation time. Compound 310 shows relatively stable free energy values around −16 Kcal/mol, whereas compound 471 exhibits more fluctuation, indicating differing stabilities in their interactions with the target.
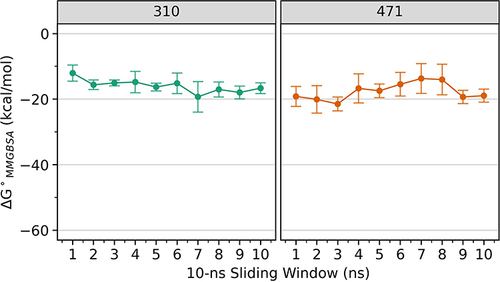
Figure 2 Comparative RMSD Profile of ACE2 Complexes with Compounds 310 (left) and 471 (right) over 100 ns simulation time. Both plots demonstrate the stability of their respective ACE2 complexes, with the x-axis indicating the simulation time in nanoseconds (ns) and the y-axis showing the RMSD values in Angstroms (Å). The consistent RMSD values suggest stable binding of the compounds to the ACE2 receptor.
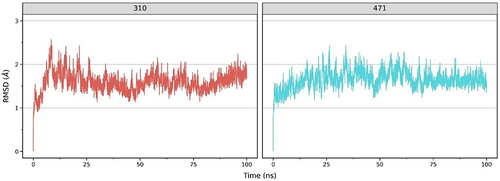
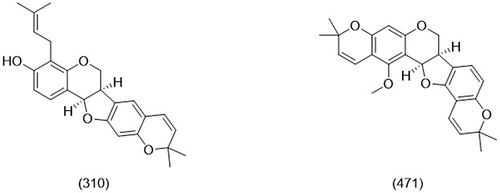
Figure 3 The chemical structure of erybraedin D (310) (left) and ganggetinin (471) (right).