Figures & data
Figure 1 Student confidence scores before and after administration of the course.
Notes: (A) Histogram depicting the distribution of student scores for the “process of fertilization and implant” component before (pre) and after (post) the course. (B) Histogram depicting the distribution of student scores for the “development of placental support” component before and after the course. (C) Histogram depicting the distribution of student scores for the “somitogenesis” component before and after the course. (D) Histogram depicting the distribution of student scores for the “principles of organ formation” component before and after the course. (E) Histogram depicting the distribution of student scores for the “development of the neural system” component before and after the course. (F) Histogram depicting the distribution of student scores for the “development of the gastrointestinal system and lungs” component before and after the course. (G) Histogram depicting the distribution of student scores for the “development of the heart” component before and after the course. (H) Histogram depicting the distribution of student scores for the “congenital abnormalities” component before and after the course.
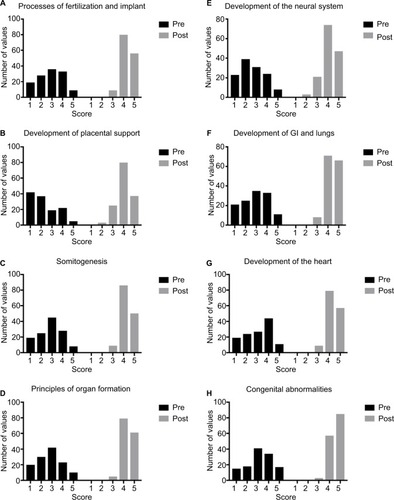
Table 1 Results of student scoring for confidence with embryology modules before and after the course (UK, 2017)
Table 2 Proportion of students who score a 4 or above before and after the course (a score of 4 reflects confidence with the component; UK, 2017)
Table 3 Student scores for delivery of the course (UK, 2017)
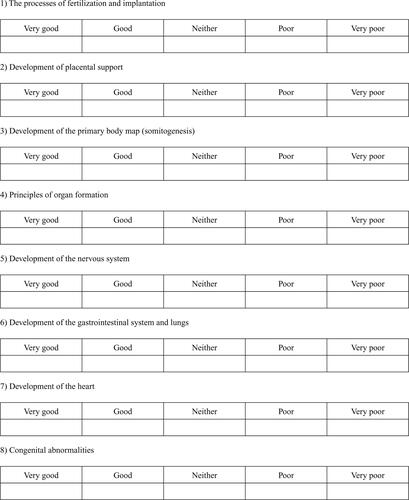
Figure S1 Precourse questionnaire.
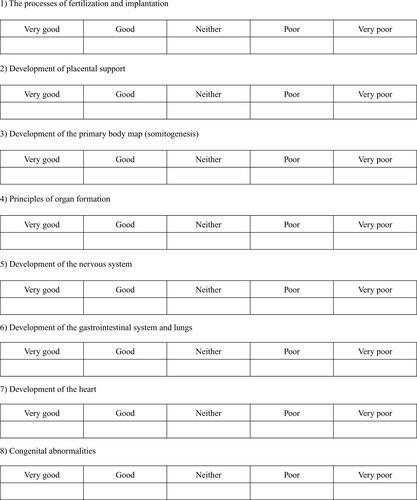
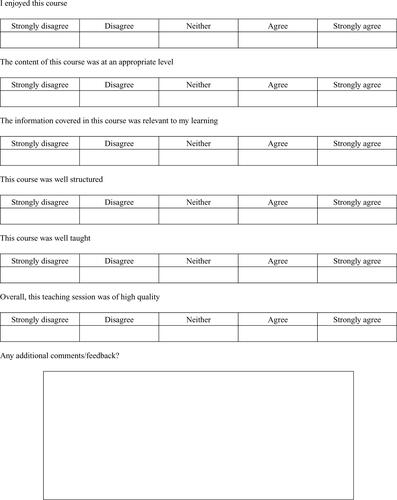
Figure S2 Postcourse questionnaire.