
Figures & data
Figure 1 Distribution of student participation in the AIP-NPLA.
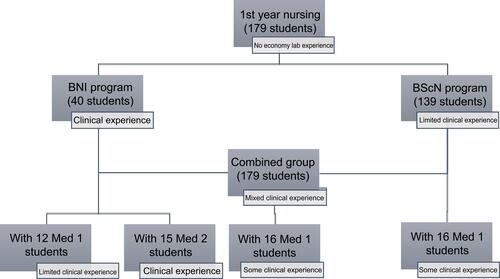
Table 1 Medical student (Med 1 and Med 2) survey response data from the Peer Teaching Experience Questionnaire (PTEQ), Copyright © 1986. John Wiley and Sons. Adapted from Brown R, Condor S, Mathews A, Wade G, Williams J. Explaining intergroup differentiation in an industrial organization. J Occup Psychol. 1986;59(4):273–286.Citation30 Data is reported as mean and standard error (S.E.). The asterisks represent statistically significant differences from Med 1 assessed by Student’s t-test (*p<0.05). After Bonferroni correction with the level of significance adjusted from 0.05 to 0.05/13=0.0038, no significant differences were found between survey responses obtained among the Med 1 and Med 2 students
Table 2 Nursing student group (BNI and BScN) responses to the Clinical Teaching Preference Questionnaire (CTPQ), Copyright © 1993. John Wiley and Sons. Adapted from Iwasiw CL, Goldenberg D. Peer teaching among nursing students in the clinical area: effects on student learning. J Adv Nurs. 1993;18(4):659–668.Citation31 Data is reported as mean and standard error (S.E.). The asterisks represent statistically significant differences from BNI assessed by Student’s t-test (*p<0.05). After Bonferroni correction with the level of significance adjusted from 0.05 to 0.05/16=0.0031, both significant differences (Q11 and Q15) were maintained
Figure 2 Distribution of the scores for question 7 of the Professional Self-Identity scale. The asterisks represent statistically significant differences from Med 1 assessed by Student’s t-test (*p<0.05; ***p<0.0001). After Bonferroni correction with the level of significance adjusted from 0.05 to 0.05/9=0.005, the significant differences found between survey responses obtained among the Med 2 and BNI and BNI and BScN were maintained.
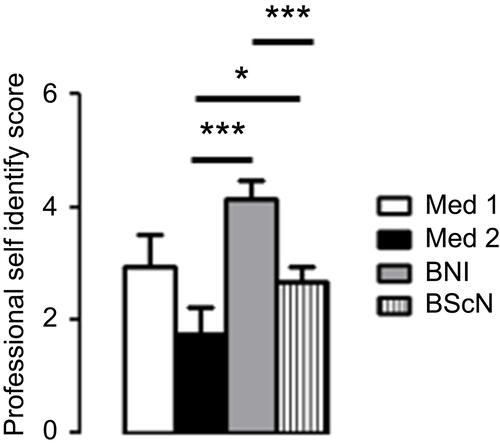
Table 3 Effect of clinical experience on interactivity between group of students with different Professional Self-Identity scores (responses from the Clinical Teaching Preference Questionnaire (CTPQ), Copyright © 1993. John Wiley and Sons. Adapted from Iwasiw CL, Goldenberg D. Peer teaching among nursing students in the clinical area: effects on student learning. J Adv Nurs. 1993;18(4):659–668.Citation31 Data is reported as mean and standard error (S.E.). The asterisks represent statistically significant differences from each individual questions of the questionnaire assessed by Student’s t-test (*p<0.05)
Table 4 Comparison of the different combination of BScN with Med 1 or BScN and BNI with Med 1 and determination of most effective format. Data is reported as mean and standard error (S.E.). The asterisks represent statistically significant differences from BScN assessed by Student’s t-test (**p<0.001). After Bonferroni correction with the level of significance adjusted from 0.05 to 0.05/6=0.0083, the significant difference found for question 4 was maintained