
Figures & data
Table 1 Bivariate Correlation Between UAT and PT, UAT and OSCE, and UAT and FMC
Figure 1 Projection of the multiple linear regression among UAT, FMC, and PT marks.
Abbreviations: UAT, university admission test; FMC, average final marks in the clerkship; PT, progress testing.
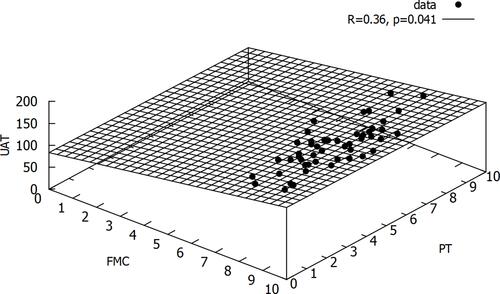
Figure 2 Projection of the multiple linear regression among UAT, OSCE and FMC marks.
Abbreviations: UAT, university admission test; FMC, average final marks in the clerkship; OSCE, Organized Structured Clinical Examination.
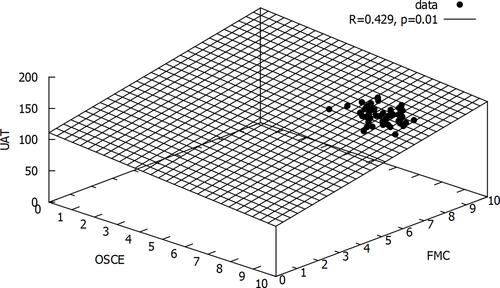
Figure 3 Projection of the multiple linear regression among UAT, OSCE, and PT marks.
Abbreviations: UAT, university admission test; OSCE, Organized Structured Clinical Examination; PT, progress testing.
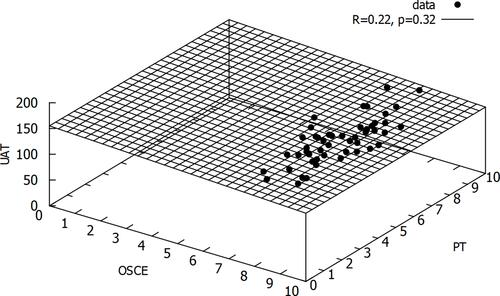
Table 2 Results from ANOVA Test for Multiple Linear Regression, Showing the Relationship Between Marks in the UAT and the Independent Variables PT, OSCE and FMC