Figures & data
Table 1 Descriptive Analysis of Student Ratings on General Teaching Skills (Questionnaire Part 1) in the Overall Sample (n = 133). Items Were Rated on 5-Point Scales with 5 Being the Most Favourable Option
Table 2 Descriptive Analysis of Student Self-Assessments and CSA Gain (Questionnaire Part 2) in the Overall Sample (n = 133). Items Were Rated on 6-Point Scales with 6 Being the Most Favourable Option. CSA Gain Was Calculated as Described PreviouslyCitation14
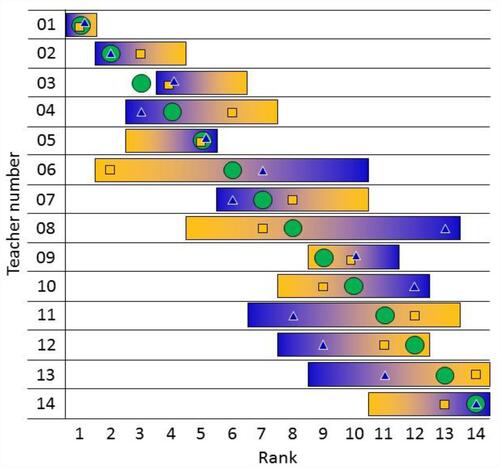
Figure 1 Teacher rankings according to various weighting algorithms. Green circles, mean of teaching skills and CSA Gain z scores; blue end of horizontal bars, teaching skills z score only; yellow end of horizontal bars, CSA Gain z score only; blue triangles, teaching skills: CSA Gain = 3:1; yellow boxes, teaching skills: CSA Gain = 1:3.