Figures & data
Table 1 General Characteristics of the Participants, N=103
Table 2 Perceptions of Participants Towards the Pathology Courses, N=103
Table 3 Participants´ Opinions Regarding the Information and Methods of Teaching Provided in the Pathology Courses, N=103
Table 4 Association Between Perception Score/ Information and Methods Score and Different Variables, N=103
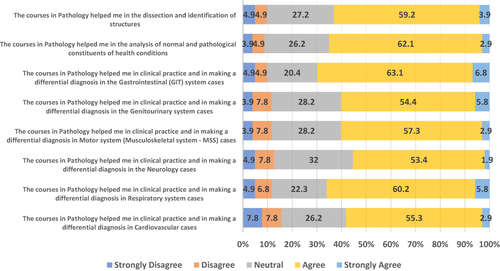
Figure 1 Impact of pathology courses on clinical practice.