Figures & data
Table 1 Demographic data of study populations
Table 2 Average likert scale scores (mean ± SD; n=341) among male and female participants
Table 3 Average Likert scale scores (mean ± SD; n=341) among year 1 and year 2 students
Table 4 Average Likert scale scores (mean ± SD; n=341) among four different lecturers
Table 5 Suggested methods for improving teaching of the present topic (n=24 of 341)
Table 6 Students’ suggestions to improve lecture class quality (n=8 of 341)
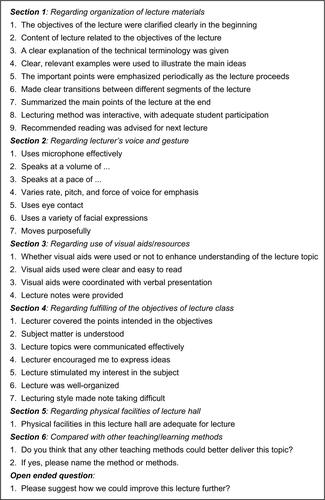
Figure S1 Evaluation of lectures: student’s perspectives.