
Figures & data
Figure 1 Timing of baseline (B) and final (F) fecal sample collection in relation to date of diagnosis and standard treatment.
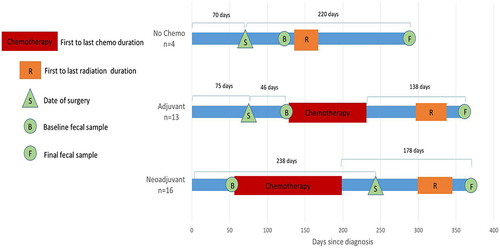
Table 1 Characteristics of 33 Breast Cancer Patients by Treatment with Baseline and End of Study Fecal Samples
Table 2 Alpha Diversity Measures and BMI at Baseline and Changes Over Time by Chemotherapy Treatment and by BMI
Figure 2 Percentage change in alpha diversity measures (OTU, Chao 1 index, Shannon index, and PD Whole tree) by chemotherapy treatment (neoADJ n = 16, ADJ n = 13, noC n = 4), and by weight changes (weight loss n = 16; weight gain n = 17).
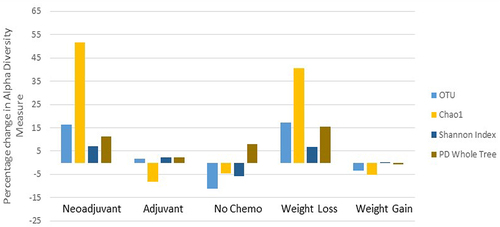
Table 3 Wilcoxon and NBMM Analyses to Examine Changes in Select Taxa Abundance Between Baseline and Final Fecal Sample by Chemotherapy Treatment: neoADJ vs. Non-neoADJ (ADJ+ noC)
Figure 3 Significantly differentially abundant taxa (p < 5% significance threshold) between the neoADJ (n = 16) vs. non-neoADJ groups (n = 17). The x-axis indicates the minus log transformed p values, so that values further to the right indicate greater statistical significance. NBMM analyses were used in both models: the unadjusted (model 1, green) and fully adjusted (adjusted for weight changes, days between baseline and final fecal collection, and last antibiotics use) (model 4, blue).
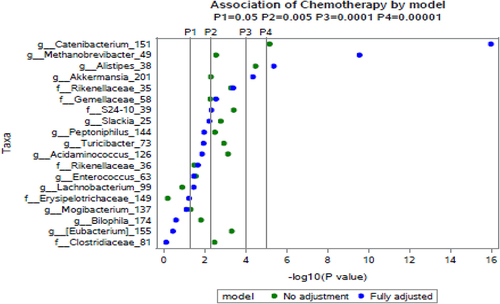
Table 4 Mean Baseline (B) and Absolute Changes (Δ) in Alpha Diversity Measures and Relative Abundance Levels of Select Taxa by Specific Chemotherapy Agents