
Figures & data
Figure 1 Diagrammatic representation of different types of ELISA.
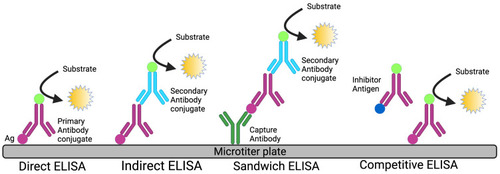
Table 1 Advantages and Disadvantages of Different Types of ELISA
Figure 2 Three-dimensional structure of Her2-antibody complexes. (Left) Structure of the extracellular domain of Her2 is shown in ribbon representation. Subdomains I–IV are shown in pale-green, orange, green and purple colors, respectively. (Middle) Structure of Her2-Trastuzumab complex is shown. Trastuzumab (blue) binds to Sbd-IV. (Right) Structure of Her2-Pertuzumab complex is shown. Pertuzumab (pink) binds to Sbd-II (PDB: 1N8Z Citation159 and 1S78 Citation160).
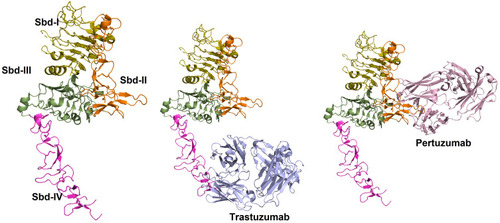
Figure 3 Schematic representation of plasmonic ELISA.
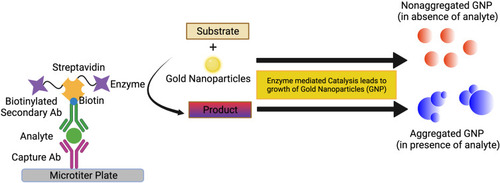
Figure 4 Schematic representation of FACTT. Reproduced from Zhang H, Cheng X, Richter M, Greene MI. A sensitive and high-throughput assay to detect low-abundance proteins in serum. Nat Med. 2006;12(4):473–477.Citation15
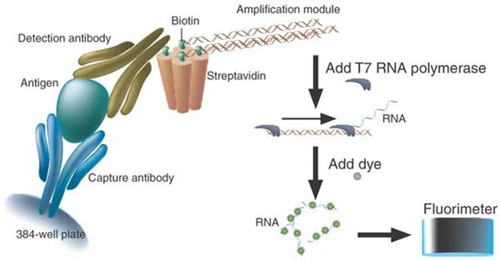
Table 2 Different Methods for Detection of Analytes and Signal Amplification