
Figures & data
Figure 1 High expression level of OVOL2 correlates good prognosis in BC patients. (A) Kaplan–Meier plots comparing OS in cases with high/low expression of OVOL2. (B) Kaplan–Meier plots comparing RFS in cases with high/low expression of OVOL2. (C) Kaplan–Meier plots comparing DMFS in cases with high/low expression of OVOL2. (D) Kaplan–Meier plots comparing PPS in cases with high/low expression of OVOL2. Quantitative data is calculated by Kaplan-Meier Plotter (Details please see MATERIALS AND METHODS).
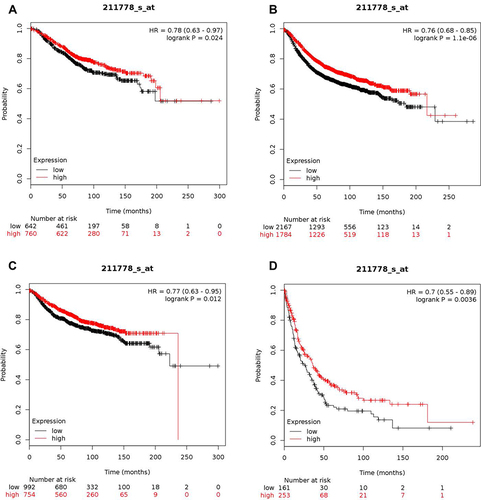
Figure 2 OVOL2 was significantly lower in basal/TNBC subtype. Expression level of OVOL2 was significantly lower in basal-like (A), TNBC (B) and basal-like and TNBC (C) subtype based on DNA microarrays of bc-GenExMiner v4.8 database. (Figures were automatically generated from the database. The “*” represents the values of samples. p < 0.0001).
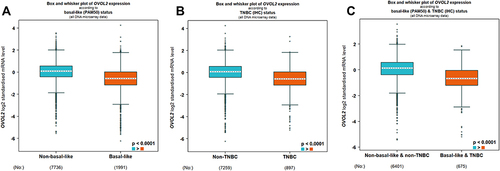
Figure 3 Promoter methylation level of OVOL2 was significantly higher in TNBC. Promoter methylation level of OVOL2 Normal, Luminal, HER2 positive and TNBC. (Comparison and Statistical significance: Normal-vs-Luminal, 1.405210E-01; Normal-vs-HER2 Positive, 1.056760E-01; Normal-vs-TNBC, 6.341600E-02; Luminal-vs-HER2 Positive, 7.800400E-03; Luminal-vs-TNBC, 6.413200E-04; HER2Positive-vs-TNBC, 6.074400E-01).
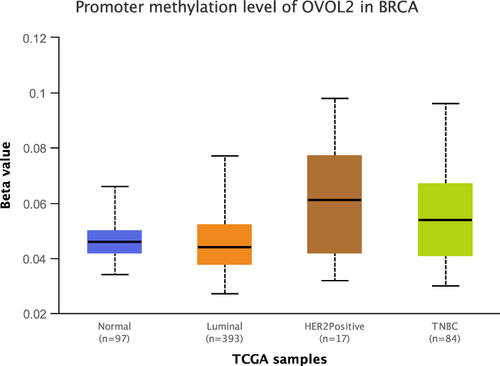
Figure 4 High expression of OVOL2 was positively correlated with survival of TNBC patients. Survival probability of TNBC patients with OVOL2 high expression was better than lower expression group. (p = 0.045).
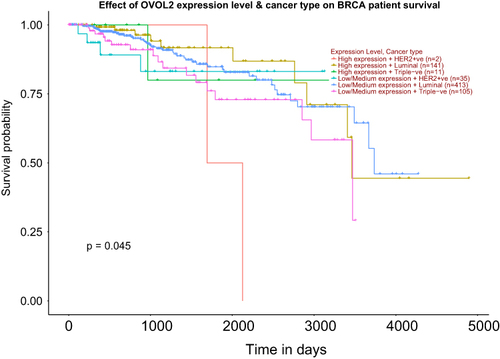
Figure 5 Venn diagram of DEGs of two GEO datasets. (A) 96 genes were detected between upregulated genes of GSE7515 and GSE15192. (B) 148 genes were intersected between downregulated genes of GSE7515 and GSE15192.
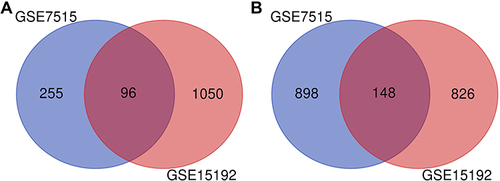
Table 1 Gene Ontology (GO) and Kyoto Encyclopedia of Genes and Genomes (KEGG) Functional Enrichment Analysis of Downregulated DEGs
Figure 6 PPI network of downregulated DEGs. A total of 142 nodes and 160 edges were involved in the PPI network, with p < 1.0 e-16.
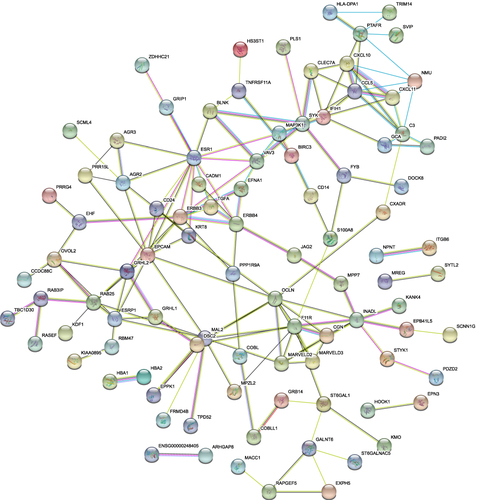
Figure 7 The top three modules of downregulated DEGs. (A) Members of module 1 are mainly involved in tight junction. (B) Members of module 2 are mainly involved in immune response. (C) Members of module 3 are mainly involved in TFs in EMT.
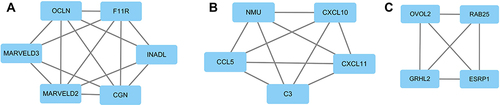
Figure 8 OVOL2, NANOG, OCT4 and SOX2 expression in mammospheres of MDA-MB-231. (A) mRNA of OVOL2 was significantly lower in mammospheres. (B) mRNA of NANOG, OCT4 and SOX2 was significantly higher in mammospheres. Quantitative data is presented as mean ± s.d. of three independent experiments. ****p<0.0001.
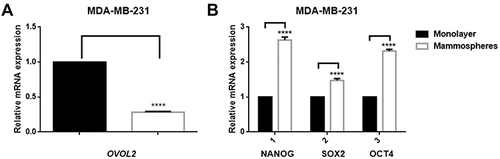
Figure 9 OVOL2 was significantly downregulated in GSE7515 and GSE15192. (A) mRNA of OVOL2 was significantly lower (p<0.05) in mammospheres (GSE7515). (B) mRNA of OVOL2 was significantly lower (p<0.0001) in CD44+/CD24− subgroup (GSE15192). Quantitative data is presented as mean ± s.d. of two GEO datasets (GSE7515 included 15 mammospheres and 11 primary breast cancer samples. GSE15192 included CD44+/CD24− and CD44−/CD24+ samples with 4 replicates respectively). *p<0.05, ****p<0.0001.
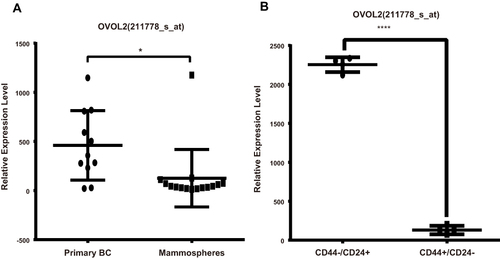
Figure 10 OVOL2 inhibited mammosphere formation of MDA-MB-231. (A) The representative images of mammospheres of control (Plv-Vec) and OVOL2 overexpression (Plv-OVOL2) groups. (B) Quantitatively analysis of mammospheres number. Quantitative data is presented as mean ± s.d. of three independent experiments. **p<0.01. Scale bars: 100 μm.
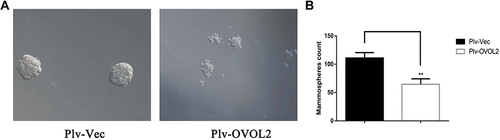
Figure 11 OVOL2 downregulated CD44+/CD24− subpopulation ratio. (A) CD44+/CD24− ratio of control group (left) and OVOL2 overexpression group (right). (B) Statistic analysis of CD44+/CD24− ratio between two groups (****p<0.0001). Quantitative data is presented as mean ± s.d. of three independent experiments.
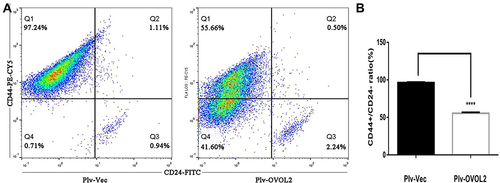
Table 2 Negative Correlation Between Expression of OVOL2 and Markers of BCSCs