Figures & data
Table 1 Cohort Description
Figure 1 Clinical outcomes of patients with ER+ and TNBC BCs. Triple negative was defined as ER/PR < 1% staining and HER2- (ie, IHC 0/1+ and non-amplified); ER+ ≥ 1% staining. Panel (A) shows recurrence-free survival; panel (B) shows overall survival.
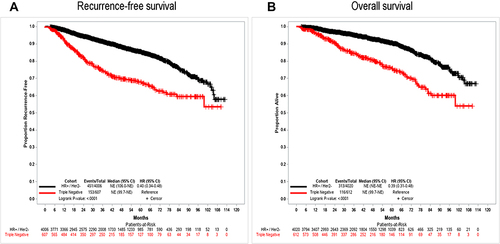
Table 2 Comparison Between ER+-Low and ER+-Intermediate Groups
Figure 2 Clinical outcomes of patients with TN, ER+-low, ER+-intermediate, and ER+-high BCs. Triple negative was defined as ER and PR < 1% staining,; ER+-low, 1–9.99% staining; ER+-intermediate, 10–19.99%; ER+-high ≥ 20% staining. Panel (A) shows recurrence-free survival; panel (B) shows overall survival.
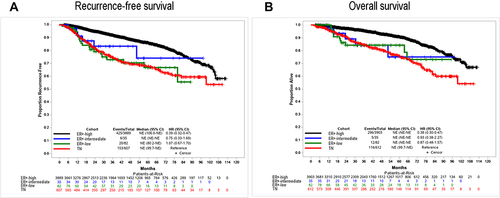
Table 3 Cox Proportional Hazards Regression -Comparative Analysis of Recurrence-Free Survival (RFS) and Overall Survival of ER+-1–19.9% Vs ER+-≥20% Staining
Table 4 Endocrine Therapy Treatment Effect (Univariate Analysis)
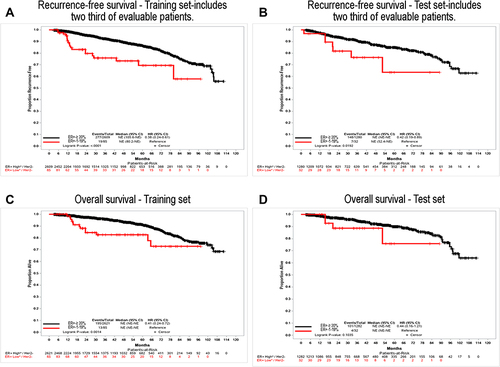
Figure 3 Clinical outcomes of patients ER+-1–19.9% staining and ER+-≥ 20% staining. Panel (A) shows recurrence-free survival for the training set, which includes two-thirds of evaluable patients; panel (B) shows recurrence-free survival for the test set, which includes one-third of evaluable patients; panel (C) shows overall survival. For the training set; panel (D) shows overall survival for the test set.