Figures & data
Figure 1 (A) Red arrows show lung metastases at baseline and (B) after 12 weeks of therapy with ribociclib.
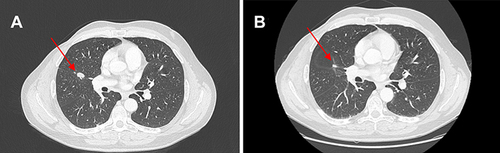
Figure 2 (A) Red arrows show liver metastases at baseline and (B) after 12 weeks of therapy with ribociclib.
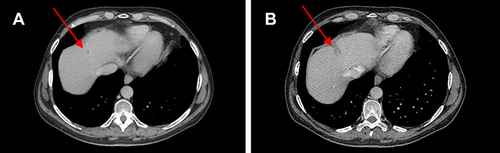
Figure 3 (A) Red arrows show lung metastases at baseline and (B) after 10 cycles of therapy with ribociclib.
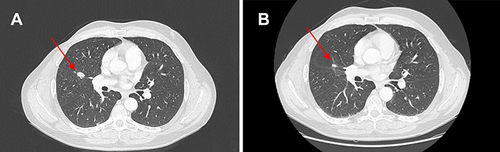
Figure 4 (A) Red arrows show liver metastases at baseline and (B) after 10 cycles of therapy with ribociclib.
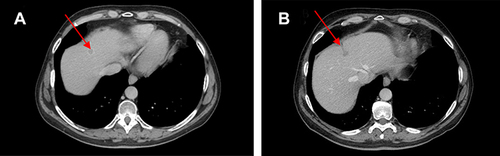
Figure 5 (A) Red arrows show brain metastases at baseline and (B) after 10 cycles of therapy with ribociclib.
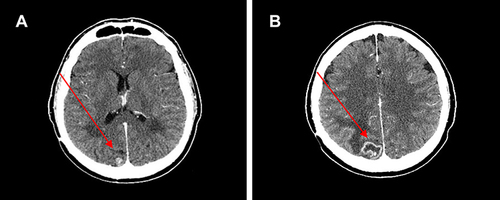
Figure 6 (A) Hepatic complete response and (B) stable brain disease after 31 months of therapy with ribociclib.
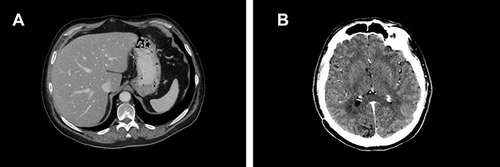
Figure 7 (A) and (B) Red arrows show liver metastases after 49 months of therapy with ribociclib.
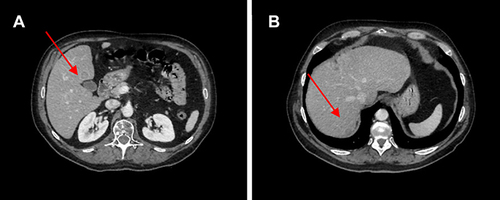
Figure 8 First CT scan evaluation. (A) Red arrows in the figures show sternum lytic metastasis, (B) lung metastasis of 30 mm diameter, (C) mediastinal lymph node of 30 mm diameter and right breast tumor, and (D) axillary lymph node.
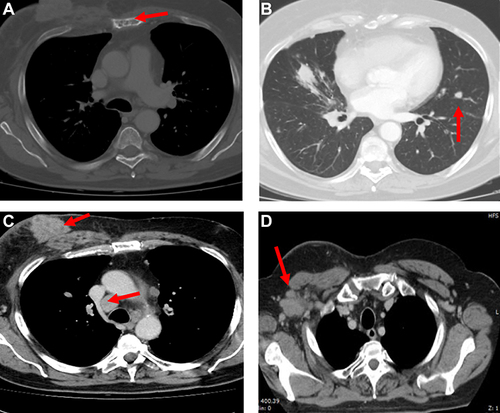
Figure 9 CT scan evaluation after treatment. (A) Red arrows in the figures show sternum lytic metastasis, (B) mediastinal lymph node, (C) axillary lymph node, and (D) lung metastasis.
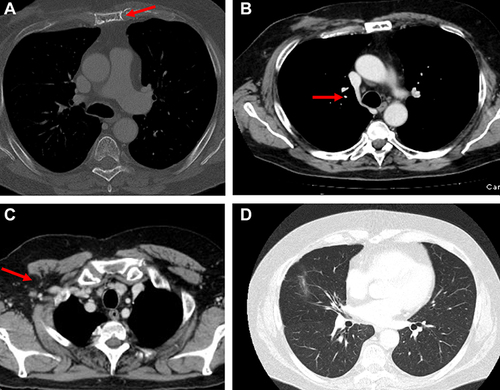
Figure 10 PET FDG evaluation.
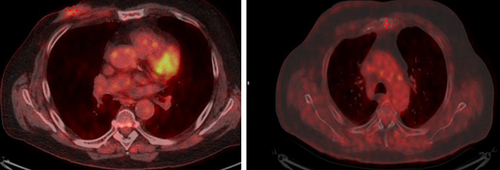
Figure 11 CT scan with bone windows. (A) Humerus shows a lytic lesion into the posterior humeral head, the cortical part of the humerus head is conserved, (B) area of osteosclerosis into the previous lytic lesion, as response to treatment, (C) further osteosclerosis area in relation to the partial recalcification of the lesion.
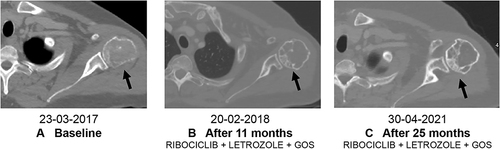
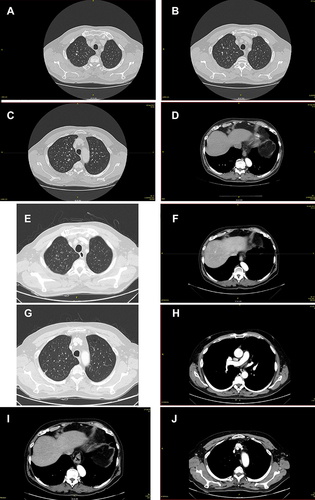
Figure 12 (A–D and G–J) CT scan of bone, lymph node, lung; (E and F) follow-up CT scan lung and lymph node.