Figures & data
Figure 1 The flow diagram of the study.
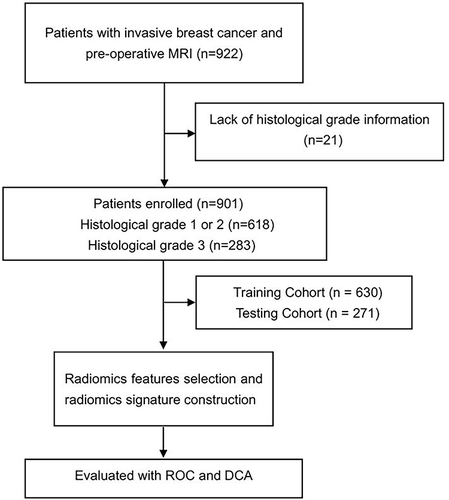
Table 1 Clinical and Tumor Features in the Training and Validation Cohorts
Table 2 Radiomics Features Selection from the CTE in the Training Cohort
Figure 2 The LASSO regression model was used to select radiomics features. (A) LASSO coefficient profiles of the 26 radiomics features. A coefficient profile plot was generated versus the selected log (λ) value using ten-fold cross-validation, where optimal λ resulted in 8 features with nonzero coefficients. (B) The 26 radiomics features’ LASSO coefficient profiles. The log (λ) sequence was used to create a coefficient profile plot. Using 10-fold cross-validation, the dotted vertical line was drawn at the value chosen.
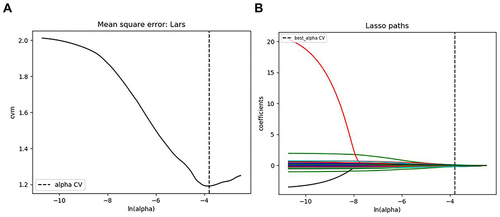
Table 3 Performance of the Radiomics Model in the Training and Validation Cohorts
Figure 3 The receiver operator characteristic curves of the radiomics model. (A) The radiomics model of ROC curves in the training cohort. (B) The radiomics model of ROC curves in the validation cohort.
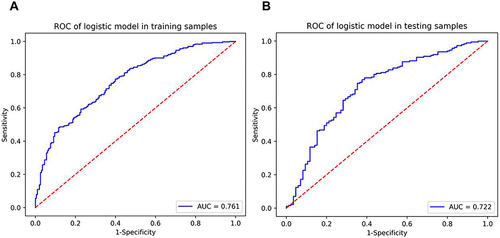
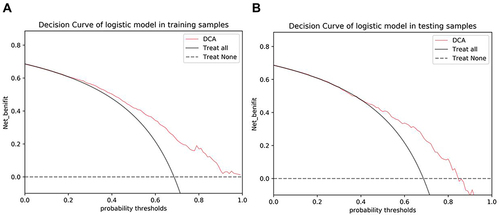
Figure 4 The decision curve analysis (DCA) of the radiomics model. (A) The radiomics model of DCA in the training cohort. (B) The radiomics model of DCA in the validation cohort.