
Figures & data
Table 1 The Subtyping Schemes
Figure 1 Distribution of BC patients in our series by subtyping.
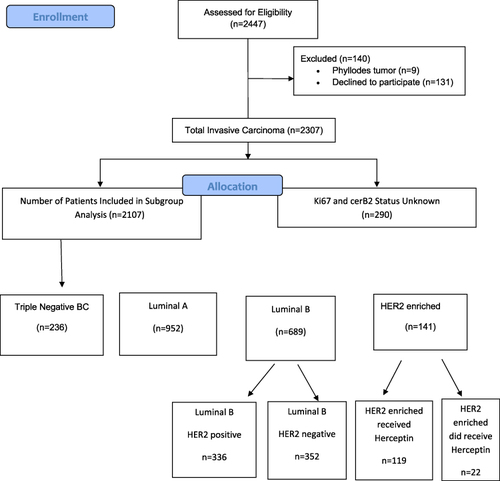
Table 2 Disease-Free Survival, and Overall Survival Times, Comparative Log Rank Test, p-values Obtained Using the Kaplan–Meier Method of Triple-Negative Breast Cancer and Not-Triple-Negative Breast Cancer Subgroups Forming Subtyping 1
Figure 2 Survival curve of DFS (A) and OS (B) for the TNBC and Not-TNBC subgroups producing subtype 1 using the Kaplan–Meier method.
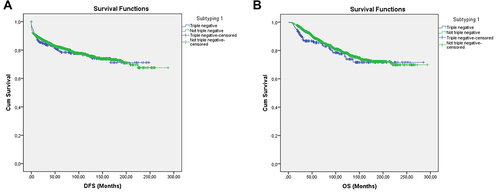
Table 3 Disease-Free Survival, and Overall Survival Times, Comparative Log Rank Test, p-values Obtained Using Kaplan–Meier Method of Triple-Negative Breast Cancer, Luminal A, and Luminal B and HER2-Enriched Subgroups Forming Subtyping 2
Table 4 Disease-Free Survival and Overall Survival Times, Comparative Log Rank Test, p-values Obtained Using Kaplan–Meier Method of Triple-Negative Breast Cancer, Luminal A and Luminal B and HER2-Enriched Received Herceptin, HER2-Enriched Did Not Receive Herceptin Subgroups Forming Subtyping 3
Figure 3 Survival curve of DFS (A) and OS (B) for TNBC, Luminal A, Luminal B, and HER2-enriched subgroups producing subtype 2 using the Kaplan–Meier method.
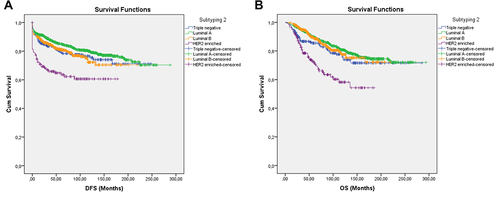
Figure 4 Survival curve of DFS (A) and OS (B) for TNBC, Luminal A, Luminal B, and HER2 -enriched subgroups that received Herceptin and the HER2-enriched subgroups that did not receive Herceptin producing subtype 3 using the Kaplan–Meier method.
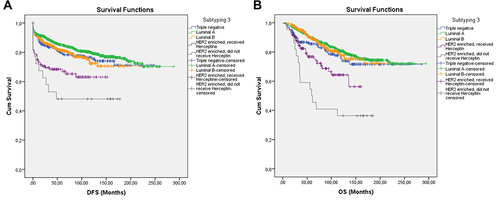
Table 5 Disease-Free Survival and Overall Survival Times, Comparative Log Rank Test, p-values Obtained Using Kaplan–Meier Method of Triple-Negative Breast Cancer, Luminal A and Luminal B HER2 Positive, Luminal B HER2 Negative and HER2-Enriched Received Herceptin, HER2-Enriched Did Not Receive Herceptin Subgroups Forming Subtyping 4
Figure 5 Survival curve of DFS (A) and OS (B) for the TNBC, Luminal A, and Luminal B subgroups that received Herceptin, the Luminal B subgroups that did not receive Herceptin, the HER2-enriched subgroup that received Herceptin, and the HER2-enriched subgroup that did not receive Herceptin, producing subtype 4 using the Kaplan–Meier method.
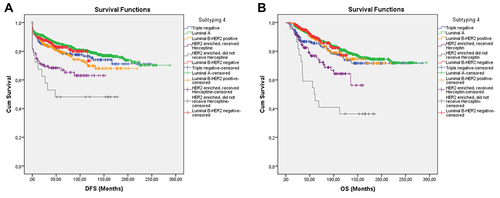
Table 6 Disease-Free Survival, Overall Survival Times, Comparative Log Rank Test, p-values Obtained Using Kaplan–Meier Method of TNBC, Luminal A, Luminal B Received Herceptin, Luminal B Did Not Receive Herceptin and HER2-Enriched Received Herceptin, HER2-Enriched Did Not Receive Herceptin Subgroups Forming Subtyping 5
Figure 6 Survival curves of DFS (A) and OS (B) for the HER2-negative, Luminal B subgroup receiving Herceptin, the Luminal B subgroup that did not receive Herceptin, the HER2-enriched subgroup that received Herceptin, and the HER2-enriched subgroup that did not receive Herceptin, producing subtype 5 using the Kaplan–Meier method.
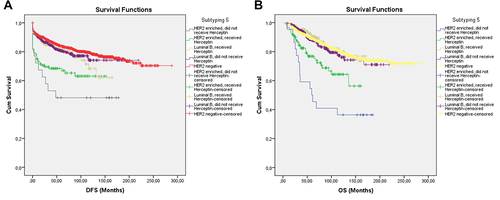
Table 7 Comparison of HER2-Enriched Subgroup with Other Subgroups
Table 8 Univariable and Multivariable Analysis of Breast Cancer Survival Using Cox’s Proportional Hazards Model Within Disease-Free Survival
Table 9 Univariable and Multivariable Analysis of Breast Cancer Survival Using Cox’s Proportional Hazards Model Within Overall Survival