Figures & data
Table 1 The Baseline Characteristics
Figure 1 The miR-381 expression in the tumor tissue of patients with different TNM stages and molecular subtypes. (A) The miR-381 expression was significantly lower in the TNBC type than in the Luminal A/B of BC with P<0.05, but there is no significantly different between TNBC and Her-2 positive subtype with P=0.9. (B) The expression of miR-381 in the tumor tissues of patients between stage I and III, as well as stage II and III patients (P<0.05). (C) METABRICH data showed high expression indicate a better prognosis in BC with HR=0.7 (0.55–0.88), log rank P=0.0028. (D) In GSE19783 dataset, KMplot showed the similar value of MIR-381 but without significance (HR=0.63 (0.27–1.47), P=0.28). The miR-381 expression in the tumor tissues of patients with different disease progression states, along with the ROC curve and K–M curve. (E) The miR-381 content in the tumor tissue of the patients with disease progression was lower than those without disease progression (*Indicates p < 0.05, **Indicates p < 0.01, ***Indicates p < 0.001, ****Indicates p < 0.0001). (F) The ROC curve suggested a cut-off of 0.2515, with a sensitivity of 65.38% (51.8%–76.85%), a specificity of 75.00% (46.77%–91.11%), and a p-value of 0.0359. (G) The K–M survival curve indicated that the patients with a high miR-381 expression had a better prognosis, with a p-value of 0.019, a median no-events time of 37 m vs Un, and an HR of 2.146 (0.9258–4.976).
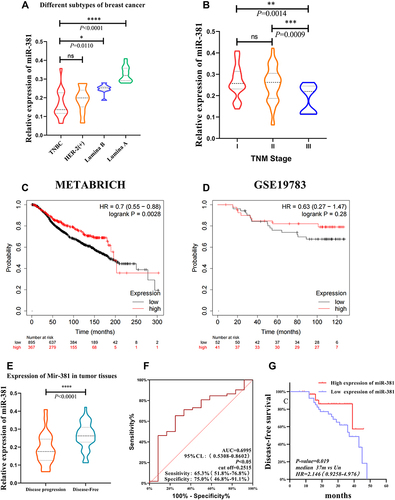
Figure 2 The miR-381 expression in patients with disease progression was lower than in patients without disease progression. (A–D) The results showed that the expression of miR-381 was was significantly downregulated in tumor tissues of patients with disease progression events (P <0.05) than the patients without disease progression in all the subtypes except for Luminal A. (E–H) The cut-off was 0.2515, with a sensitivity of 65.38% (51.8–76.85%) and a specificity of 75.00% (46.77–91.11%) in the ROC curve. K–M analysis indicated that the patients with high miR-381 expression had better prognoses. *Indicates p < 0.05, **Indicates p < 0.01.
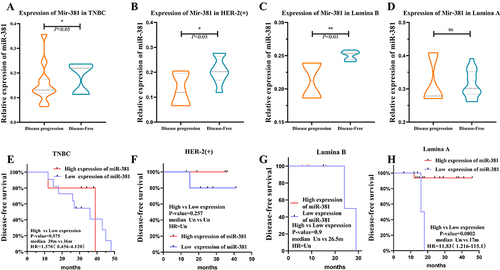
Table 2 Univariate Regression and COX Multivariate Regression Analysis
Figure 3 LASSO regression results. (A) When the lambda = 0.000394, the model converged to factor = 9, indicating that the included indicators were all statistically significant. The cross-LASSO multi-layer analysis indicated that, in the case of CV.LASSO_1se/CV.LASSO_min, Ki-67 and miR-381 were the significant factors. (B) The model was: βx = −1.2672 + 0.01598 × Ki-67 −0.7206 × miR-381.
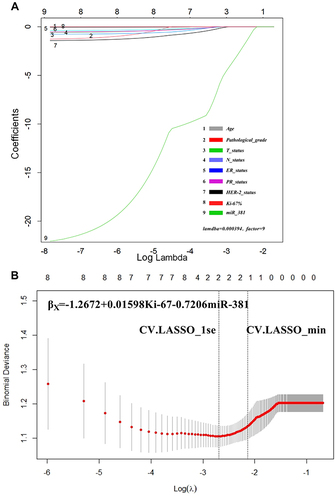
Table 3 NRI of Different Models Comparing with miR-381+Ki-67+T+N Model
Figure 4 (A) The AUC of miR-381+Ki-67+T+N model was the largest. The AUC of miR-381+Ki-67+T+N model is 0.719 (0.580, 0.857), the AUC of miR-381 model is 0.713 (0.575, 0.848), the AUC of Ki-67 model is 0.698 (0.613, 0.742), the AUC of Ki-67+T+N model is 0.712 (0.575, 0.848), and the prediction efficiency of T+N model is the lowest, AUC is 0.479 (0.329–0.629). (B) The ROC curve of time dependence showed that the predictive performance at 1.5 year was AUC=0.9075, at 2 year was AUC=0.8468, at 2.5 year was AUC=0.8789, at 3 year was AUC=0.9066, at 3.5 year was AUC=0.7724.
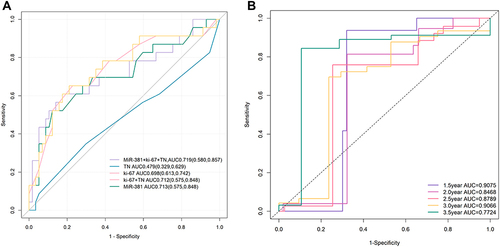
Figure 5 The NRI was used to further evaluate the improvement of the model. (A) miR-381+Ki-67+T+N model was better than T+N model; (B–D) Ki-67+T+N model was slightly better than the miR-381, Ki-67 model.
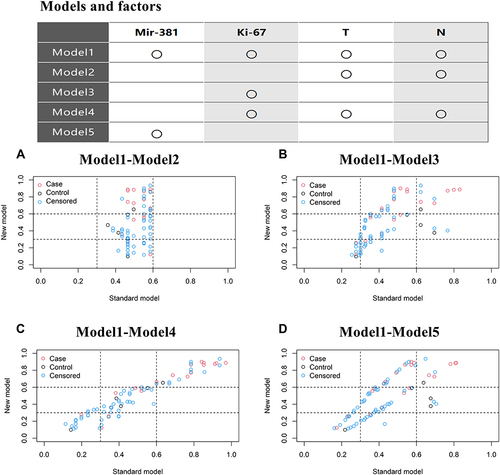
Figure 6 The nomogram of the miR-381+Ki-67+T+N models. The TN, miR-381, and Ki-67 model; For example, one patient was T1N0 with a miR-381 content of 2.9 and a Ki-67 of 40%. The model predicted that the risk of the occurrence of disease progression in three years was approximately 0.56, and the risk of the occurrence of a disease progression event in five years was approximately 0.25.
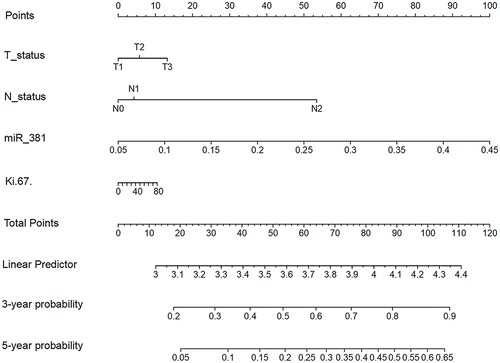
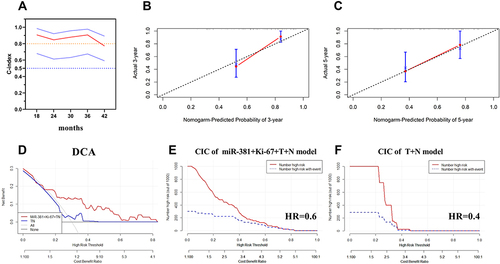
Figure 7 The calculation of the models’ consistency using the concordance (C)-index. (A) The concordance (C)-index of the miR-381+Ki-67+T+N model was 0.719, with a 95% CI of (0.580, 0.857); (B and C) The predicted and actual probabilities of disease progression events at three and five years showed the model had good consistency; (D) The DCA curve indicated that the clinical benefit of the miR-381+Ki-67+TN model was superior to the TN model, with a disease progression rate of 30%; (E) CIC of the miR-381+Ki-67+TN model, it demonstrated good performance over the entire range of threshold probabilities; (F) CIC of the TN model, the red curve has a steep downward trend, when HR is about 0.4, the two curves coincide.