Figures & data
Table 1 Baseline Characteristics
Table 2 Subgroup Analysis of Short-Term Response
Figure 1 Kaplan–Meier curves of PFS for patients.
Notes: (A) Overall cohort. (B) Patients treated with pyrotinib combined with capecitabine as second-line anti-HER2 therapy. (C) Patients stratified by lines of anti-HER2 therapy. (D) Patients stratified by lines of systematic therapy.
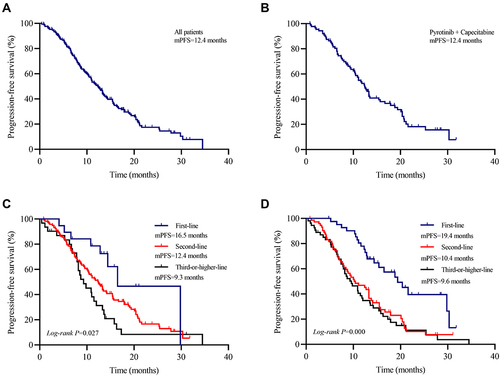
Figure 2 Kaplan–Meier curves of PFS for patients treated with different regimens.
Notes: (A) Patients treated with pyrotinib alone or combined regimens. (B) Patients treated with pyrotinib combined with capecitabine or other chemotherapeutic drugs (non-capecitabine). (C) Patients treated with single (pyrotinib) or dual anti-HER2 (pyrotinib combined with trastuzumab) therapy.
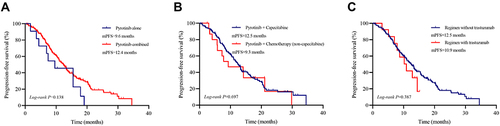
Figure 3 Kaplan–Meier curves of PFS for patients with different characteristics.
Notes: (A) Patients stratified by HR status according to pathological characteristics. (B) Patients stratified by pertuzumab-treated or pertuzumab-naive according to prior treatment history. (C) Patients stratified by sensitivity to trastuzumab according to prior treatment history. (D) Patients stratified by liver metastasis according to clinical characteristics. (E) Patients stratified by brain metastasis according to clinical characteristics. (F) Patients stratified by number of metastatic sites according to clinicopathological characteristics.
Abbreviation: HR, hormone receptor.
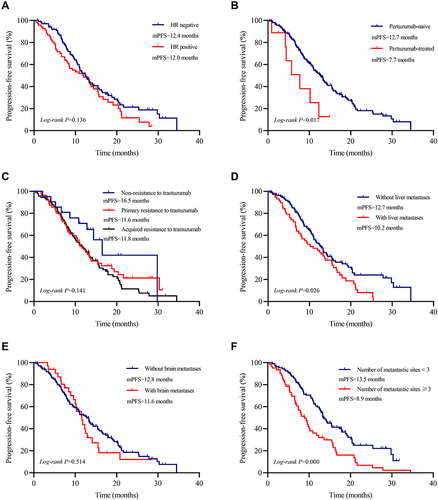
Table 3 Adverse Events
Figure 4 Exploration of potential factors or biomarkers influencing efficacy and outcome of pyrotinib-based therapy.
Notes: (A) The objective response rate for patients stratified by diarrhea grade. (B) PFS for patients stratified by diarrhea grade. (C) The objective response rate for patients stratified by VEGF-A expression level. (D) PFS for patients stratified by VEGF-A expression level.
Abbreviation: VEGF-A, vascular endothelial growth factor A.
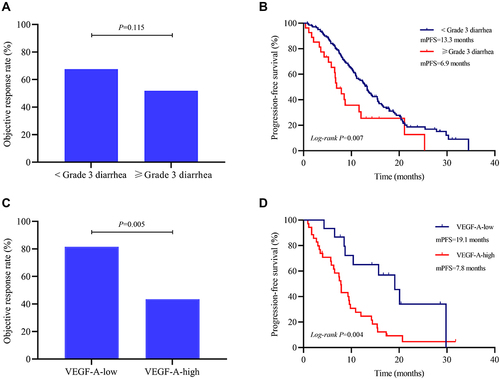
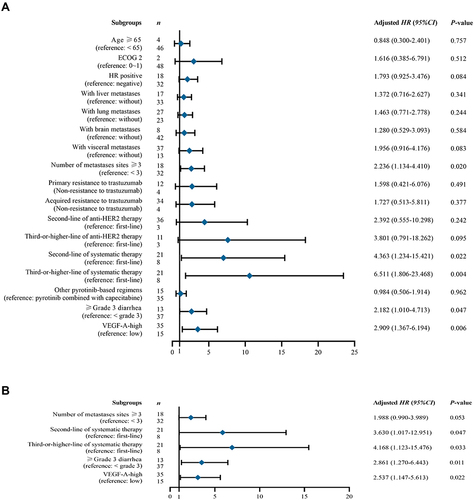
Figure 5 Cox regression analyses of PFS in 50 HER2-positive MBC patients with baseline detection of VEGF-A.
Notes: (A) Forest plot of univariate Cox regression analyses. (B) Forest plot of multivariate Cox regression analyses.
Abbreviations: ECOG, eastern cooperative oncology group; HR positive, hormone receptor positive; HER2, human epidermal growth factor receptor 2; VEGF-A, vascular endothelial growth factor A; Adjust HR (95% CI), Adjust hazard ratios (95%confidence interval).