Figures & data
Table 1 CTC Number Assessed for Each Patient Based on Chromosome Aneuploidy
Figure 1 CTCs in patients with breast cancer. White arrows showed the identified CTCs. Scale bar is 10 μm.
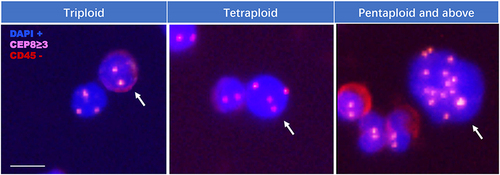
Table 2 DNA Status in CTCs and ctDNA of Patients with Breast Cancer
Figure 2 Her-2/HER2 status in the tissue of the 3 patients. (A) The Her-2 protein expression in the primary tissue of patient ID1, ID2, and ID3, and in the liver metastasis tissue of patient ID3 were detected by IHC test. (B) The copy number of HER2 gene in the tumor tissue of patient ID2 was detected by FISH test. (C) The copy number of HER2 gene in the primary and liver metastasis tissue of patient ID3 were detected by FISH test.
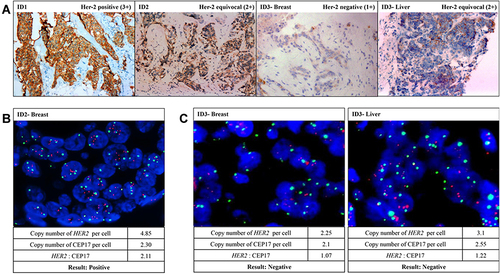
Figure 3 Clinical timelines of the 3 patients with breast cancer. The HER2 targeted drug trastuzumab were highlighted in bold type. DFS, disease-free survival; PFS, progression-free survival.
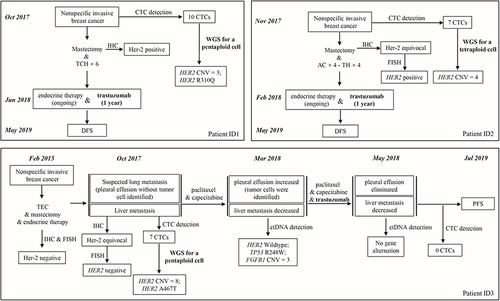
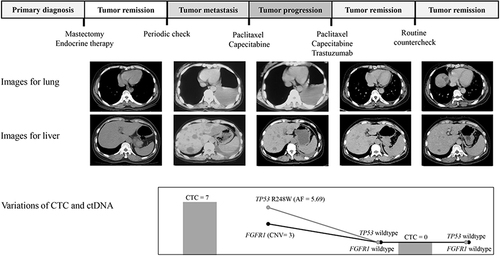
Figure 4 Variations of imaging and molecular biomarker features in Patient ID3 during a series of medical treatments. Treatment process is showed in the top. Images of the lung (upper) and liver (lower) metastasis are listed in the middle. Variations of CTC (grey column) and ctDNA (black line for CNV of FGFR1; grey line for mutation of TP53 R248W) are presented in the bottom.