Figures & data
Figure 1 The decision tree and partitioned survival model structure overview for HER2-low breast cancer patients. Group 1 represents overall patients, which includes HR-positive and HR-negative patients. Group 2 represents the HR-positive patients. The intervention and comparator of each group is T-DXd and chemotherapy, respectively. The PartSA containes three health states: progression-free, progressed disease and death.
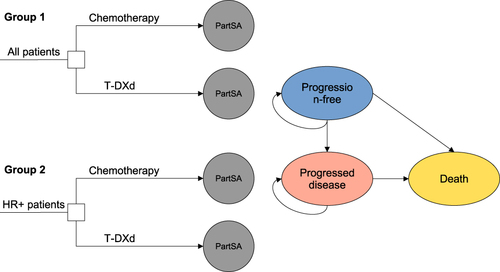
Table 1 Key Clinical Data
Table 2 Model Costs, Utility Estimates and Other Parameters
Figure 2 Reconstructed Kaplan-Meier survival curve and the projected survival curve in different groups. (A) Output of PFS curve for all patients group; (B) Output of OS curve for all patients group; (C) Output of PFS curve for the HR+ patients group; (D) Output of OS curve for the HR+ patients group. Each cycle of the x-axis is three weeks.
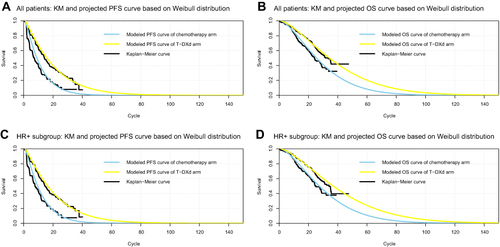
Table 3 Results of the Base-Case Analysis
Figure 3 Tornado diagram of the one-way sensitivity analysis results. (A) The output of all patients group. (B) The output of HR-positive subgroup.
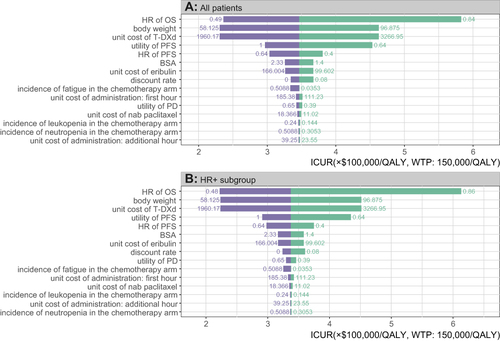
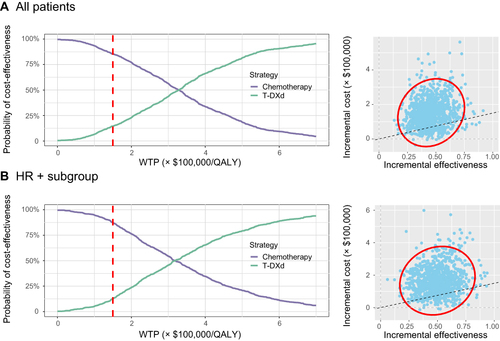
Figure 4 The output of probabilistic sensitivity analysis. (A) The output of all patients group. (B) The output of HR-positive subgroup.