Figures & data
Figure 1 Flow cytometry analysis results to quantify dendritic cell surface marker expressions. (a) MHC I, (b) MHC II, (c) CD 40 costimulatory, and (d) CD 80 costimulatory. All results are expressed as mean ± SD (n=3). Statistical significance as observed by post-hoc analysis of ANOVA with cells alone treatment group as the negative control. *p<0.05, ***p<0.001, and ****p<0.0001.
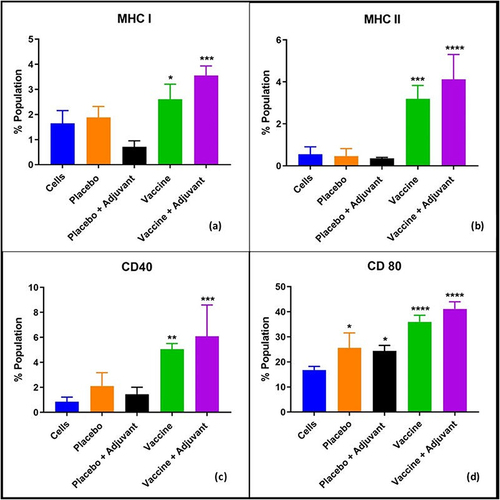
Figure 2 TNF-alpha cytokine release as observed in the DC/T-cell co-culture model for various time points (4–24 hours). All the results are expressed as mean ± SD (n=3). Statistical significance as observed by post-hoc analysis of ANOVA with cells alone treatment group, at the corresponding time interval, as the negative control. *p<0.05, **p<0.01, and ****p<0.0001.
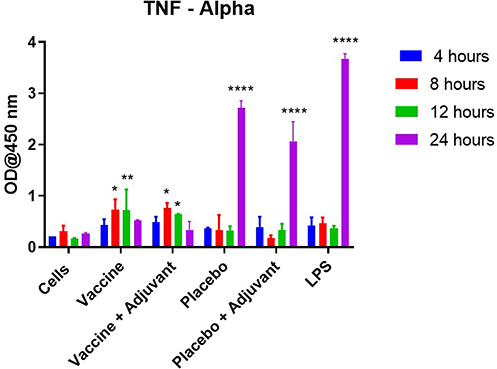
Figure 3 IFN-gamma cytokine release as observed in the DC/T-cell co-culture model for various time points (4–24 hours). All the results are expressed as mean ± SD (n=3). Statistical significance as observed by post-hoc analysis of ANOVA with cells alone treatment group, at the corresponding time interval, as the negative control. ****p<0.0001.
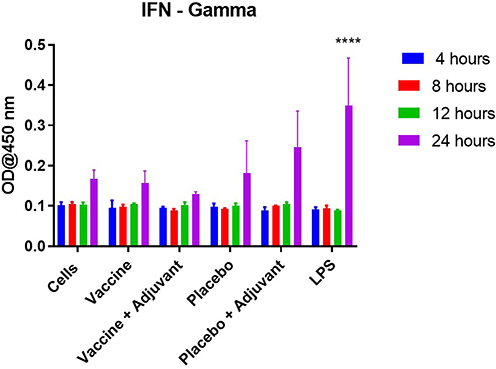
Figure 4 IL-2 cytokine release as observed in the DC/T-cell co-culture model for various time points (4–24 hours. All the results are expressed as mean ± SD (n=3). Statistical significance as observed by post-hoc analysis of ANOVA with cells alone treatment group, at the corresponding time interval, as the negative control. ****p<0.0001.
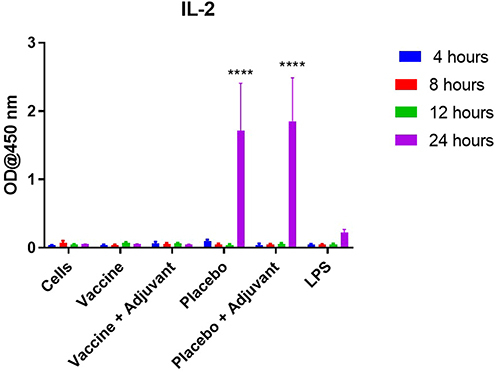
Figure 5 Quantification of T-cells post microparticle treatment demonstrates a significantly higher live T-cell population when treated with vaccine microparticles (both in the absence and presence of the adjuvant). All the results are expressed as mean ± SD (n=3). Statistical significance as observed by post-hoc analysis of ANOVA with cells alone treatment group as the negative control. ****p<0.0001.
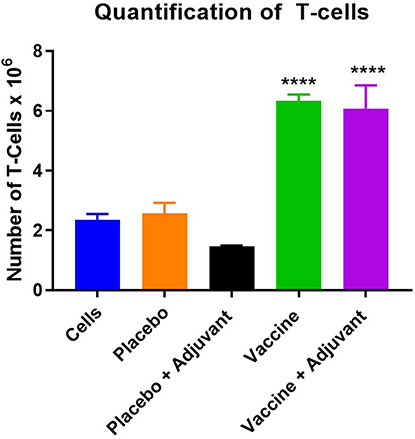
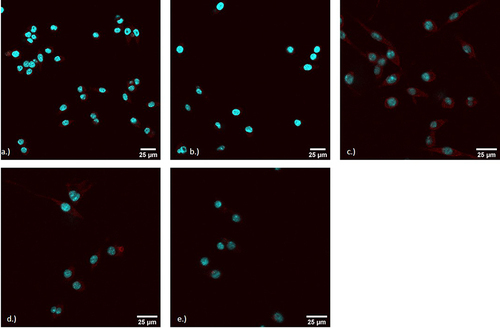
Figure 6 Confocal images of DC2.4 cells after co-culture with T-cells. Images were processed with ImageJ and imaged under a 40X water objective. Cells were stained for 24 hours with a MHC I antibody. Cells were stained with fluorophores NucBlue (DAPI) and Alexa 555 secondary antibody for visualization.(a) Vaccine + Adjuvant (b) Placebo + Adjuvant (c) Vaccine only (d) Placebo only (e) Cells only.
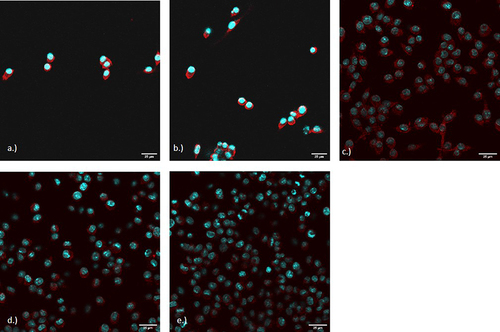
Figure 7 Confocal images of DC2.4 cells after co-culture with T-cells. Images were processed with ImageJ and imaged under a 40X water objective. Cells were stained for 24 hours with a MHC Class II antibody. Cells were stained with fluorophores NucBlue (DAPI) and Alexa 555 secondary antibody for visualization. (a) Vaccine + Adjuvant (b) Placebo + Adjuvant (c) Vaccine only (d) Placebo only (e) Cells only.
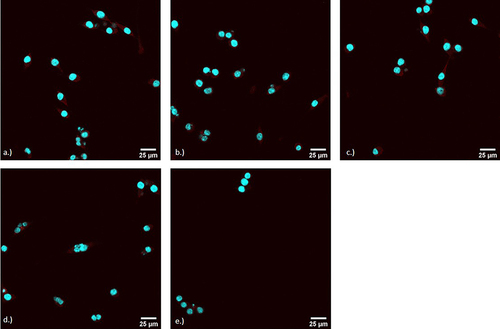
Figure 8 Confocal images of DC2.4 cells after co-culture with T-cells. Images were processed with ImageJ and imaged under a 40X water objective. Cells were stained for 24 hours with a CD40 antibody. Cells were stained with fluorophores NucBlue (DAPI) and Alexa 555 secondary antibody for visualization. (a) Vaccine + Adjuvant (b) Placebo + Adjuvant (c) Vaccine only (d) Placebo only (e) Cells only.
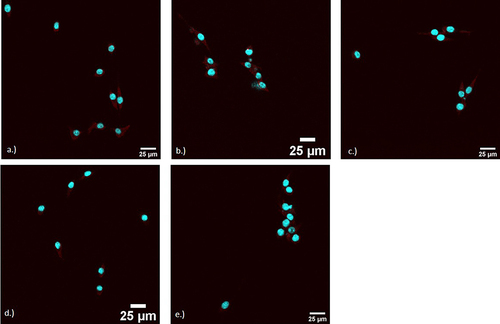
Figure 9 Confocal images of DC2.4 cells after co-culture with T-cells. Images were processed with ImageJ and imaged under a 40X water objective. Cells were stained for 24 hours with a CD80 antibody. Cells were stained with fluorophores NucBlue (DAPI) and Alexa 555 secondary antibody for visualization. (a) Vaccine + Adjuvant (b) Placebo + Adjuvant (c) Vaccine only (d) Placebo only (e) Cells only.