Figures & data
Figure 1 Effects of single and combined treatments on cell proliferation, and on ZNF217 gene copy number in ERα+ cells after 24h, 48h and 96h. (A and B) MCF7 cells. (C and D) BT474 cells. Error bars represents mean standard deviation of 24 replicates. Differences between control and treatments were evaluated with Dunnett’s multiple comparisons test (see Supplementary Tables 1 and 2).
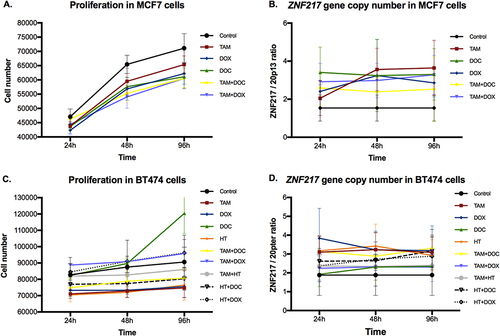
Figure 2 Representative FISH images of BC cells after TAM treatment for 24h, 48h and 96h. FISH was performed on nuclei spreads for ZNF217 gene and for neighboring regions (20p13) as control, using a dual color probe labeled with different spectrum colors: spectrum orange for ZNF217 gene and spectrum green for 20p13 region. Interphase nuclei at each treatment time point are indicated. The scale bars at the bottom right of each FISH image are indicative of the surface area of the nucleus. Ctrl: Control, untreated cells.
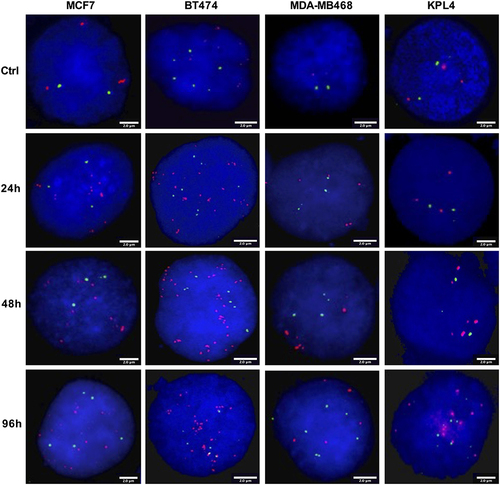
Figure 3 Effects of single and combined treatments on cell proliferation, and on ZNF217 gene copy number in ERα- cells after 24h, 48h and 96h. (A and B) MDA-MB468 cells. (C and D) KPL4 cells. Error bars represents mean standard deviation of 24 replicates. Differences between control and treatments were evaluated with Dunnett’s multiple comparisons test (see Supplementary Tables 3 and 4).
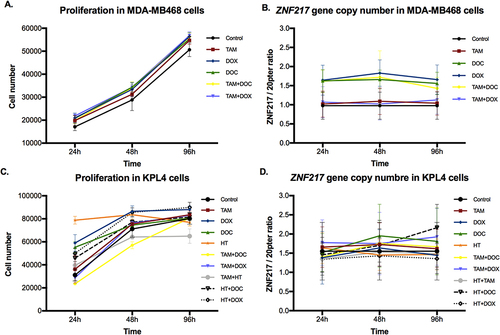
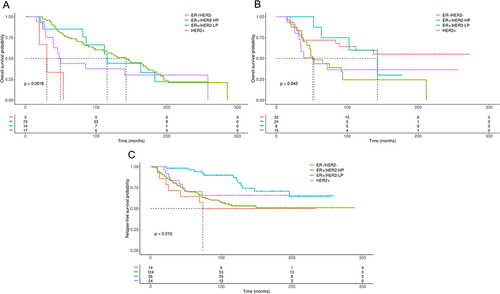
Figure 4 Kaplan–Meier plots of (A) OS and (B) RFS in BC patients with ZNF217 gene amplification or gene gain, versus BC patients without ZNF217 gene amplification or gene gain. (C) Kaplan–Meier plots of RFS in BC patients with ZNF217 gene amplification or (D) ZNF217 gene gain according to molecular subtypes defined by 3 gene classifier model. p value was determined using the Log rank test.
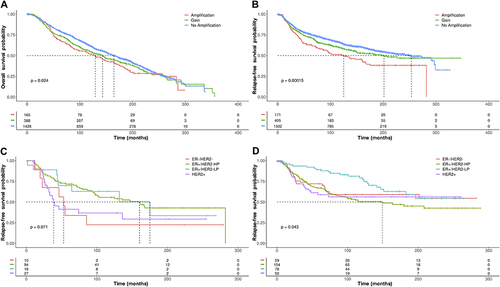
Figure 5 Kaplan–Meier plots of OS or RFS in BC patients with ZNF217 gene amplification or gain according to molecular subtypes defined by 3 gene classifier model and treated with CT or HoT. (A) OS in BC patients with ZNF217 gene amplification treated with HoT. (B) OS in BC patients with ZNF217 gene gain treated with CT. (C) RFS in BC patients with ZNF217 gene gain, treated with HoT. p value was determined using the Log rank test.