Figures & data
Table 1 Minimum Acceptable Regimens for Chemotherapy for Participation in Previous Trials
Table 2 Baseline Characteristics of the SYSUCC-001 Trial
Table 3 Subgroup Analysis of DSM in Capecitabine Group and Observation Group According to Doses
Table 4 Interactive Analysis of DSM in Capecitabine Group and Observation Group According to Regimen Dose Standard
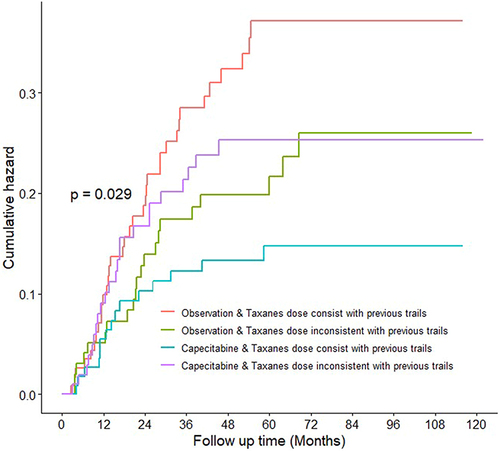
Figure 1 Cumulative hazard divided by taxane dose in the capecitabine group and observation group. Median observation for all curves was 61 months (interquartile range, 44–82 months). Cumulative hazards were estimated using Kaplan–Meier analysis and compared using log rank tests. Hazard ratios with 95% confidence intervals were estimated using a Cox proportional hazards model.