
Figures & data
Table 1 Clinical Evaluation Parameters
Figure 1 Patient at baseline T0 and T4. In the yellow circle it is possible to see the complete regression of the inflamed and desquamated area (yellow arrows).
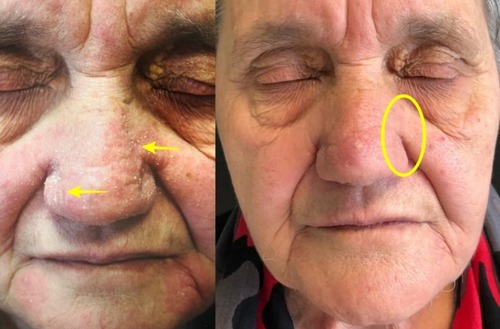
Figure 2 Patient at T0 (left) and T4 (right). Here we can notice the local inflammation has reduced (yellow circle), whilst the skin watermark has improved (yellow arrows).
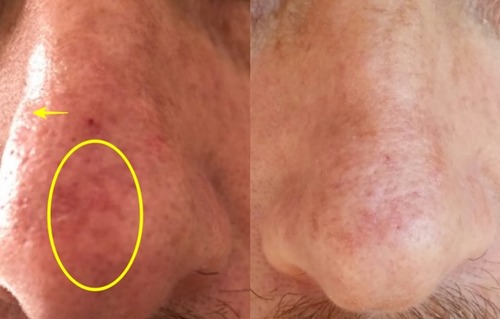
Table 2 Investigator Global Assessment (IGA) Score by Retrospective Review of Clinical Charts and Photographs and Patient Global Assessment of Treatment (PGA) Based on 5-Point Likert Scale