Figures & data
Figure 1 (A) Forward scatter versus side scatter with primary gate on the monocyte region depending on cell size and granularity. (B-D) The monocyte area was selected where double positive for both CD163 PE and CD 14 FITC. The single CD14 FITC positive are in the lower right quadrant, single CD163 PE positive are in the upper left quadrant, double positive are in the upper right quadrant. LL had significantly higher mCD163 (46.68±22.17) than BL (16.80±8.71) and TL (14.72±3.41) (p<0.001), but insignificant difference between BL and TL (p=0.1).
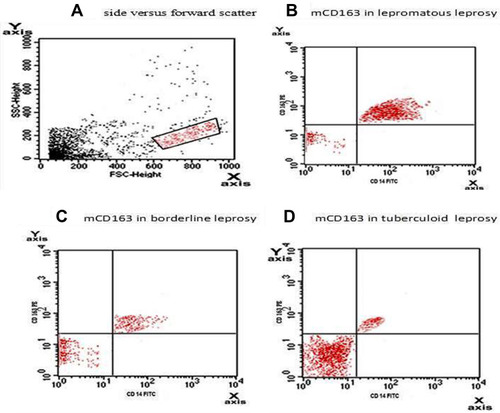
Table 1 Demographic and Clinical Data of Studied Subjects
Table 2 Comparison Between Patients and Controls Regarding Complete Blood Count (CBC), Serum sCD163 and Flow Cytometric Assessment
Table 3 Comparison Between the Studied Leprosy Types Regarding Laboratory Data
Figure 2 Correlation between mCD163 positive monocytes and sCD163 serum levels in leprosy patients (r=0.896, p<0.001).
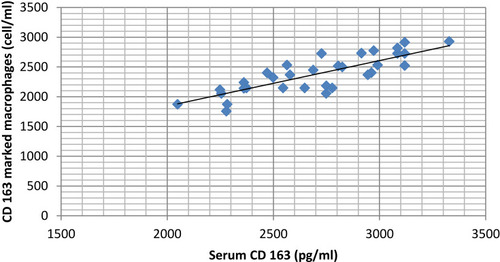
Table 4 Baseline Data in Leprosy Patients in Relation to Serum sCD163 and mCD163 Positive Monocytes
Table 5 Correlation Between WBCs and Platelet Counts with Serum sCD163 and mCD163 Positive Monocytes
Figure 3 Receiver operator characteristic (ROC) curve analysis in the detection of leprosy. (A) Serum sCD163: area under the curve was 0.87, best cut off was 100.11 pg/mL, sensitivity of 92.9% and specificity of 90% (p<0.001). (B) Monocytes mCD163: area under the curve was 0.96 and best cut off was 10.95 cells/mL with sensitivity of 91.4% and specificity of 90% (p<0.001).
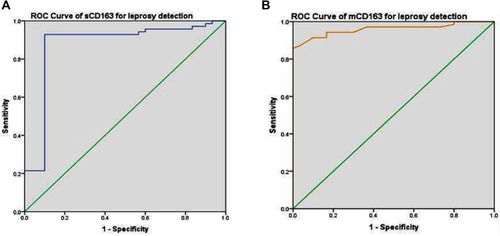
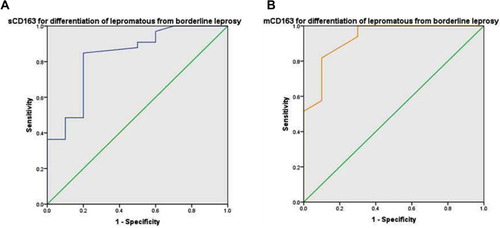
Figure 4 Receiver operator characteristic (ROC) curve analysis in the typing of leprosy. (A) Serum sCD163: area under the curve was 0.83 with sensitivity of 84.8% and specificity of 80% for differentiation between border-line and lepromatous leprosy types with best cut off level of 379.13 pg/mL (p =0.002). (B) Monocytes mCD163: area under the curve was 0.93 with sensitivity of 87.9% and specificity of 80% for differentiation between border-line and lepromatous leprosy types with best cut off level of 22.5 cells/mL (p<0.001).