Figures & data
Figure 1 Preclinical bioscreen to estimate cellular response to AMS treatment. “Cell survival index” for HEMa, HHFK and HEMa-HHFK co-culture systems following 24 (A), 48 (B), 72 (C) and 96 h (D) of treatment with the indicated concentrations (0.5÷3 mg/mL) of AMS supplement. Results are expressed in line graphs as percentage of untreated control cells and are reported as mean of four independent experiments ± SEM (n = 20). ***p<0.001 vs control (untreated cells); **p<0.01 vs control (untreated cells). (E) Microphotographs by phase-contrast light microscopy at a 100 × magnification (10 × objective and a 10 × eyepiece) of HHFK and HEMa cell monolayers, and HEMa-HHFK co-cultures for cytomorphological changes analysis at end-points (96 h) after incubation with 3 mg/mL of AMS nutraceutical, as indicated. The shown images are representative of four independent experiments.
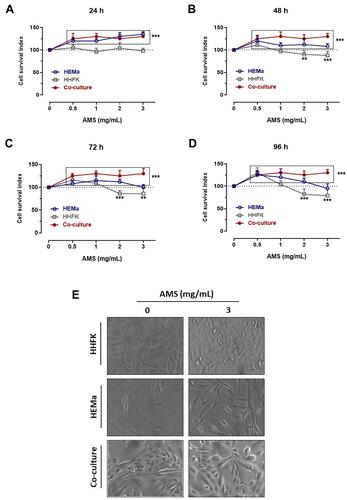
Figure 2 Total melanin content assay in HEMa cells and HEMa-HHFK co-cultures by spectrophotometric assay following 48 (A) and 96 h (B) of incubation in vitro with the indicated concentrations of AMS (0.5÷3 mg/mL), or after UVB irradiation under controlled conditions (40 mJ/cm2), as described in the experimental section. Results are normalized based on cell count. ***p<0.001 vs control (untreated cells); *p<0.01 vs control (untreated cells).
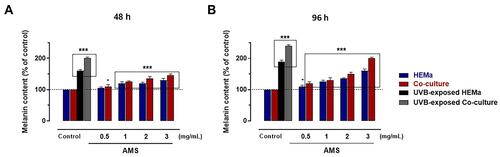
Figure 3 Tyrosinase (Tyr) expression study by immunodetection analysis in HEMa and HEMa-HHFK co-cultures incubated for 48 (A) and 96 h (B) with different concentrations of AMS supplement (0.5, 1, 2, and 3 mg/mL) or irradiated by UVB under controlled conditions. Membranes were incubated with 1:250 monoclonal tyrosinase antibody. Images are representative of four independent experiments and are cropped from original blots, as explicit by using clear delineation with dividing lines and white space (original acquisitions for Western blot experiments are shown in Figure S1). The anti-GAPDH antibody was used to standardize the amounts of proteins in each lane.
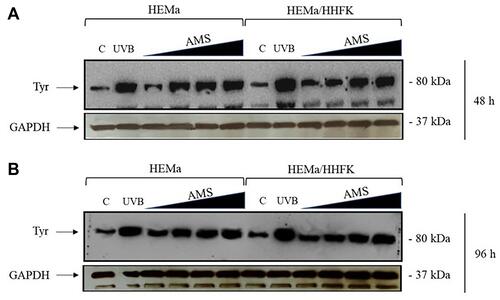
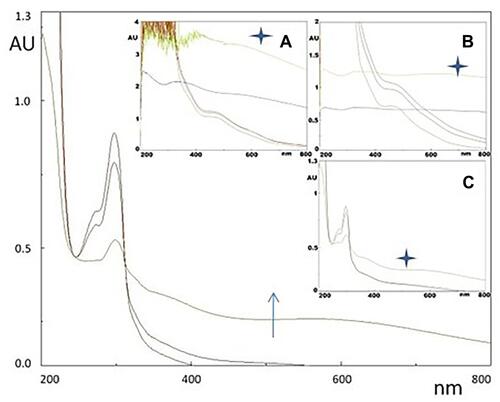
Figure 4 UV-vis profiles of DHI (6 mg/100 mL pH 7.0) autoxidation (arrow denotes time progress, stars denote 24 h reaction time) along the process of melanin pigment formation. The broad maximum at around 600 nm denotes melanochrome formation. In the insets, the same process is monitored in presence of A) AMS formulation (0.6 mg/100 mL), C) quercetin (0.6 mg/100 mL) as an internal antioxidant control, and B) plot is the blank.