Figures & data
Table 1 Results of TCR Gene Rearrangement in Skin, LN, PB and BM Cells
Figure 1 Representative images of skin manifestations and pathological examination of skin biopsy from the patient. (A) Keratoderma and fissures on her hands. (B and C). Nail thickening with color change on her hands (B) and feet (C). (D) Exfoliation on her back. (E–I) The skin biopsy shows non-specific dermatitis ((E) for original magnification × 40, (F) for original magnification × 400, (G–I) for original magnification × 200). (E and F) perivascular lymphocytes infiltration in the superficial dermis. (G) Positive staining for CD3. (H) Positive staining for CD4. (I) Positive staining for CD7.
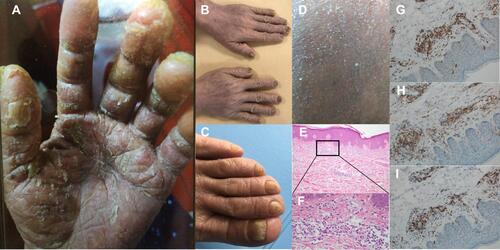
Figure 2 Pathological examination of the lymph node biopsy. (A and B). The lymph node biopsy shows extensive involvement of Langerhans cells in the sinus and paracortical regions, which present pale staining compared with residual follicles (A for original magnification × 25, (B) for original magnification × 200). (C–I) Immunohistochemical staining results ((D) for original magnification × 25; (C), (E–I) for original magnification × 40). (C) Positive staining for CD3. (D) Positive staining for CD20. (E) Positive staining for CD68. (F) Positive staining for CD1a. (G) Positive staining for S-100. (H) Negative staining for cyclinD1. (I) Positive staining for CD207.
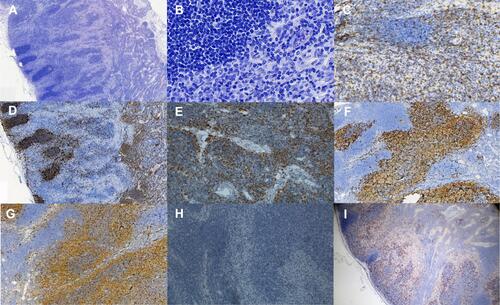
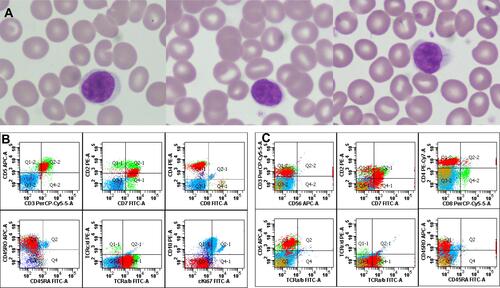
Figure 3 Representative images of morphology and flow cytometric immunophenotyping. (A) Representative images of Sézary cells in peripheral blood (original magnification×1000). (B) Representative scatter plots for peripheral blood; abnormal mature T lymphocytes were monoclonal (CD3dim+, CD5+, CD7+, CD4+, CD8-, CD45RO+, CD45RA-, TCRαβ+, TCRγδ-, CD10-, and cKi67-). (C) Representative scatter plots for bone marrow; abnormal mature T lymphocytes were monoclonal (CD3dim+, CD2+, CD7+, CD4+, CD8-, CD45RO+, CD45RA-, CD5+, TCRαβ+, TCRγδ-, and CD56-).