Figures & data
Figure 1 Metformin prohibits free fatty acids (FFA)-treated human keratinocyte proliferation. HaCat cells were treated with 400 μM FFA for 10 days, and then the intervention groups were co-treated with metformin at different concentrations and FFA for additional 4 days. (A) Metformin inhibited triglyceride (TG) level of HaCaT cells. (B) Metformin inhibited HaCaT cell proliferation analyzed by CCK8. Metformin (40mM) increased the mRNA levels of p16 (C) and p21 (D). (E) Metformin (40mM) promoted HaCaT cells apoptosis. Representative FACS analysis (left panel) and the ratios (right panel) of Annexin V+ PI− HaCaT cells. Data are presented as the mean ± SD and are representative of three independent experiments. *p < 0.05.
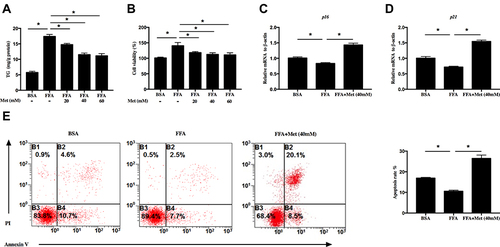
Figure 2 Metformin alleviated oxidative stress in FFA-treated human keratinocyte. HaCat cells were treated with 400 μM FFA for 10 days, and then the intervention groups were co-treated with metformin (40mM) and FFA for additional 4 days. (A) Immunoblot of superoxide dismutase 2 (SOD2) and catalase (CAT) in HaCaT cells. Total (B) CAT activity and (C) SOD activity in HaCat cells. (D) Total ROS levels in the HaCat cells. Data are presented as the mean ± SD and are representative of three independent experiments. *p < 0.05.
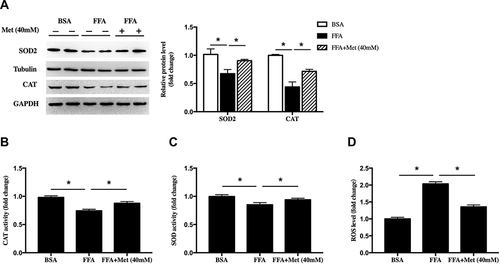
Figure 3 Metformin promotes autophagy in FFA-treated human keratinocyte. HaCat cells were treated with 400 μM FFA for 10 days, and then the intervention groups were co-treated with metformin (40mM) and FFA for additional 4 days. (A) Immunoblot of LC3 and P62 in HaCaT cells. (B) Representative confocal images of HaCat cells expressing GFP-RFP- LC3 and quantitation of early autophagosome puncta and autolysosome puncta following FFA and metformin treatment. Yellow showed co-localization of GFP and RFP, indicating early autophagosomes. Red only showed autolysosomes, scale: 20 μm. Data are presented as the mean ± SD and are representative of three independent experiments. *p < 0.05.
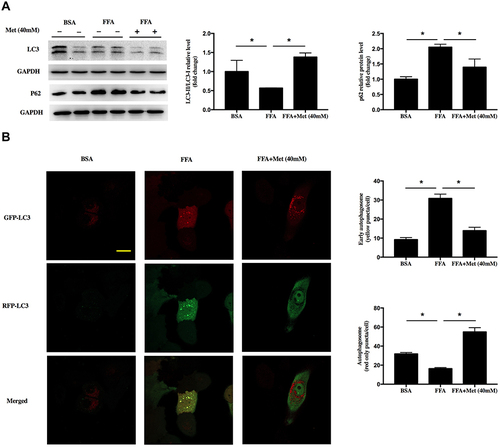
Figure 4 Forkhead box O 3 (FOXO3) was involved in the reduction of reactive oxygen species (ROS) by metformin in FFA-treated human keratinocyte. HaCat cells were treated with 400 μM FFA for 10 days, and then the intervention groups were co-treated with metformin (40mM) and FFA for additional 4 days. (A) Immunoblot of FOXO3 in the nucleus of HaCaT cells. HaCat cells were transfected with FOXO3 shRNA or scramble control (SC) by lentivirus. (B) Immunoblot of FOXO3 in the HaCaT cells. HaCat cells were pretransfected with FOXO3 shRNA or scramble control (SC) by lentivirus, then treated with 400 μM FFA for 10 days. After that, the intervention groups were co-treated with metformin (40mM) and FFA for additional 4 days. (C) Proliferation of the HaCaT cells detected by CCK8. mRNA levels of p16 (D) and p21 (E) in the HaCaT cells. ROS levels (F), total SOD activities (G) and CAT activities (H) in HaCat cells. (I) Immunoblot of SOD2 and CAT in HaCaT cells. A: BSA; B: FFA; C: FFA+Metformin (40mM). Data are presented as the mean ± SD and are representative of three independent experiments. *p < 0.05.
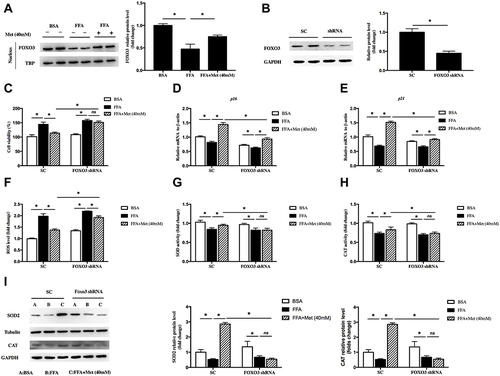
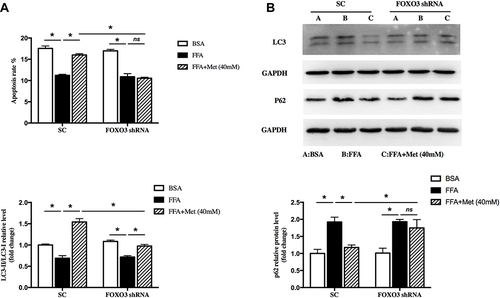
Figure 5 FOXO3 mediated the effect of pro-autophagy by metformin in FFA-treated human keratinocyte. HaCat cells were pretransfected with FOXO3 shRNA or empty vector by lentivirus, then treated with 400 μM FFA for 10 days. After that, the intervention groups were co-treated with metformin (40mM) and FFA for additional 4 days. (A) Cell apoptosis was detected by FACS analysis. (B) Immunoblot of LC3 and P62 in HaCaT cells. A: BSA; B: FFA; C: FFA+Metformin (40mM). Data are presented as the mean ± SD and are representative of three independent experiments. *p < 0.05.