Figures & data
Figure 1 Limited space for conventional attachment device.
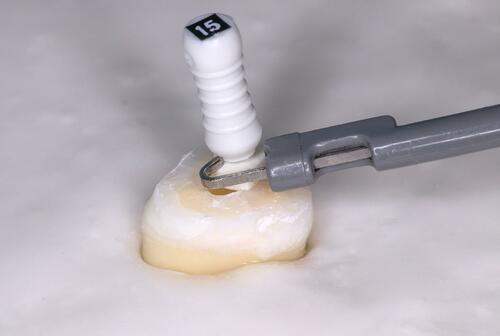
Table 1 Exclusion Criteria for Teeth Selection
Figure 2 K-file inserted into the root canal under the microscope, exceeding the apical foramen.
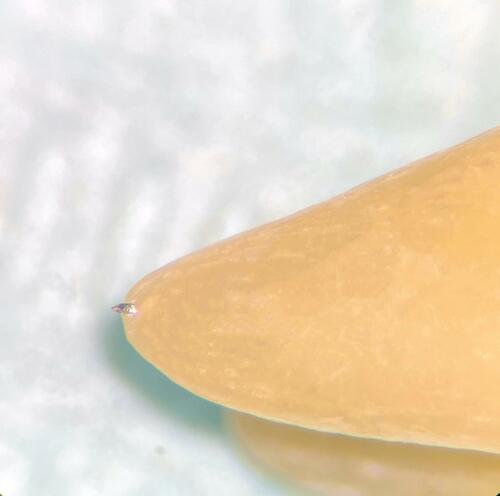
Figure 3 Under the microscope, the K-file was inserted into the root canal at the most cervical edge of the apical foramen.
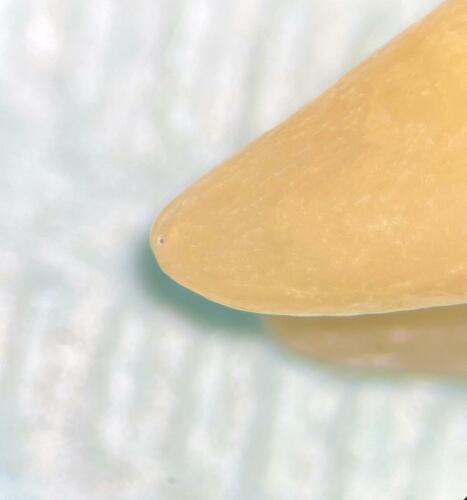
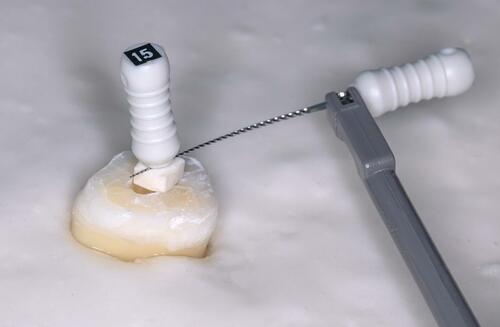
Figure 4 Alginate apparatus for electronic working length determination.
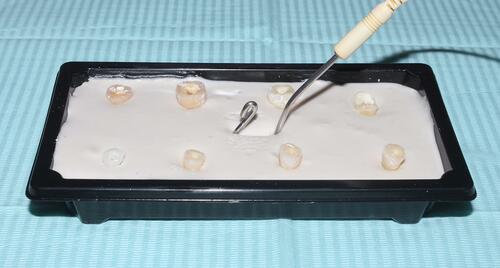
Table 2 Normality Assessment of the Data Using Kolmogorov–Smirnov and Shapiro–Wilk’s Tests
Table 3 Statistics Values of Real Working Length and Length Determined by the Two Techniques
Table 4 Results of One-Way Analysis of Variance (ANOVA) Test
Table 5 Results of Tukey’s Post-Hoc Tests
Figure 5 Apexoconnection technique shows clinical significance when limited space is available.