Figures & data
Figure 1 PRISMA flowchart of the search strategy.
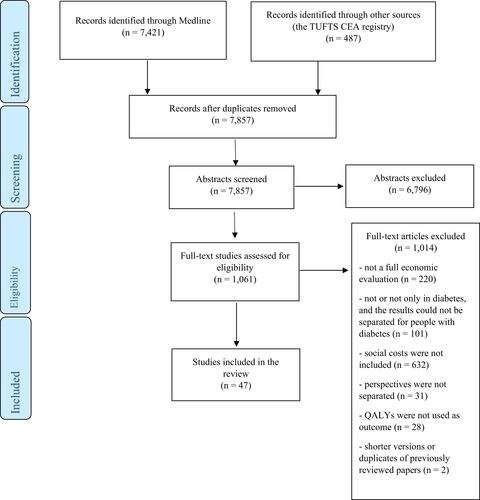
Table 1 Descriptive Information on the Selected Studies (n = 47)
Table 2 Incremental Costs, QALYs and ICURs from the Healthcare Payer/Provider and the Societal Perspective in the Estimations That Changed Results or Conclusions After the Inclusion of Social Costs
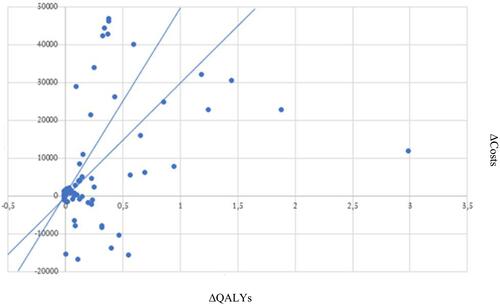
Figure 2 Incremental Cost-Utility Ratios from the healthcare perspective. For ease of comparison, results are shown in additional euros per additional QALY, applying the euro-currency exchange rates of the year of each record. The values were not updated to any base year since the efficiency thresholds applied as a usual reference are usually kept constant over several years. In this sense, and to facilitate the interpretation of the results of both panels, two vectors were drawn with the values of €30,000/QALY and €50,000/QALY since they are frequently cited thresholds in the economic evaluation literature.
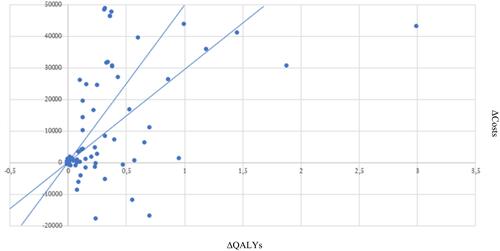
Figure 3 Incremental Cost-Utility Ratios from the societal perspective. For ease of comparison, results are shown in additional euros per additional QALY, applying the euro-currency exchange rates of the year of each record. The values were not updated to any base year since the efficiency thresholds applied as a usual reference are usually kept constant over several years. In this sense, and to facilitate the interpretation of the results of both panels, two vectors were drawn with the values of €30,000/QALY and €50,000/QALY since they are frequently cited thresholds in the economic evaluation literature.