Figures & data
Figure 1 Flowchart describing the inclusion of patients.
Abbreviations: n, number; CABG, coronary artery bypass grafting; EQ-5D, EuroQol 5 Dimensions questionnaire; VAS, visual analog scale.
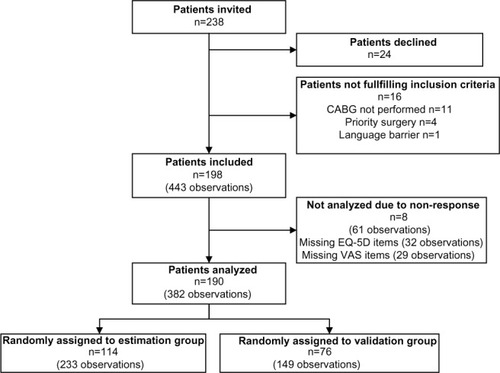
Table 1 Patients’ baseline and intraoperative characteristics
Figure 2 Questionnaire used to assess health on visual analog scales.
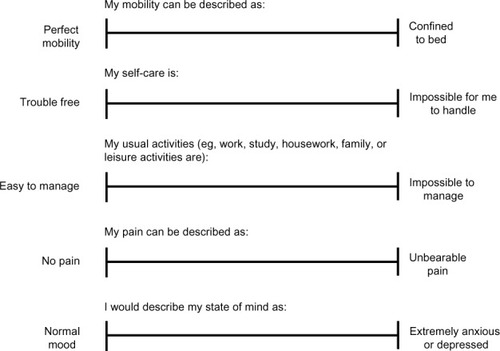
Figure 3 Observed EQ-5D utility scores in the complete dataset.
Abbreviaton: EQ-5D, EuroQol 5 Dimensions questionnaire.
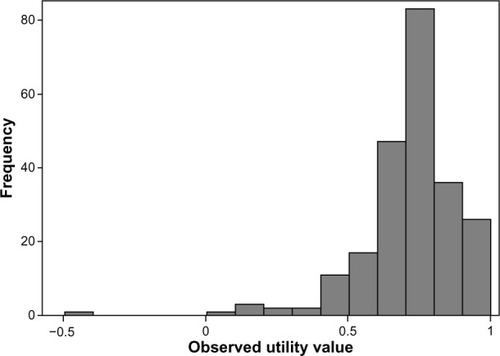
Table 2 Mean utility and VAS scores for all observations
Figure 4 Mean observed and predicted EQ-5D utility scores in the validation sample.
Notes: The graph shows the agreement between the observed EQ-5D utility score and the mean of the predicted score. The observed health states are ordered on the x-axis according to their severity as valued by the Danish time trade-off tool.
Abbreviation: EQ-5D, EuroQol 5 Dimensions questionnaire.
Abbreviation: EQ-5D, EuroQol 5 Dimensions questionnaire.
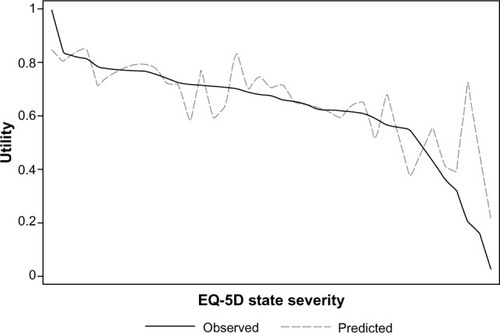
Table 3 Results of the estimated mapping-models
Table 4 Mean absolute error of mapping-models at subsets of observed EQ-5D utility scores
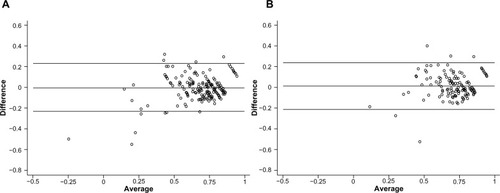
Figure 5 Bland–Altman plots of agreement between observed and predicted EQ-5D utility scores.
Notes: (A) Agreement in the estimation sample. (B) Agreement in the validation sample. The x-axis depicts the mean of the observed value and the predicted value, and the y-axis shows the difference (observed minus predicted). The lines show the mean difference, ie, the estimated bias, and the 95% limits of agreement (±1.96 SD of the mean difference).
Abbreviations: EQ-5D, EuroQol 5 Dimensions questionnaire; SD, standard deviation.
Abbreviations: EQ-5D, EuroQol 5 Dimensions questionnaire; SD, standard deviation.