Figures & data
Table 1 (A) Mean Values of REC, DET, RAD2D and WWR in the Normal and ARHL Groups. (B) Mean Values of These Parameters Across the 5 ARHL Sub-Groups (The Same of )
Table 2 Mean Values of REC, DET, RAD2D and WWR Parameters Across the 3 ARHL Sub-Groups (Q1, Q2, Q3)
Figure 1 Mean pure-tone hearing thresholds averaged, from the normal and the ARHL TEOAE data.
Notes: The ARHL data refer to the initial age classification of 5 groups. Bars represent the standard errors.
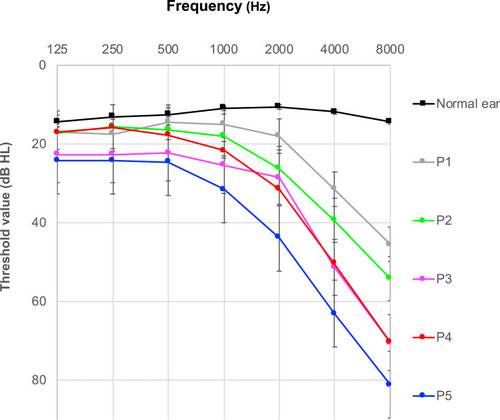
Figure 2 TypicalCitation32 recurrence plots (top panel) and the corresponding TEOAE responses (bottom panel) from a normal and an ARHL case.
Notes: In the recurrence plots the horizontal (i) and vertical (j) coordinates represent the point position along the TEOAE response time-series. The corresponding recurrence matrix was calculated using the recurrence threshold radius= 15, other input RQA parameters: lag=1; emb=10; line=8 (see Appendix A). The TEOAE responses show the fluctuations of the TEOAE amplitude in uPa, have a duration of 20ms and contain 512 datapoints. (A) On the left is depicted the recurrence plot from a normal subject (44ys). A reduction in the deterministic structure is observed. The values of the parameters of interest are: REC: 39.42, DET: 88.89, ENT: 5.517, WWR: 89%, RAD2D: 1.661). (B) On the right, the data from the ARHL case with: REC:8.68, DET:54.62, ENT:3.79, WWR:10% and RAD2D: 3.35. Note the low WWR value and the large estimate of the RAD2D.
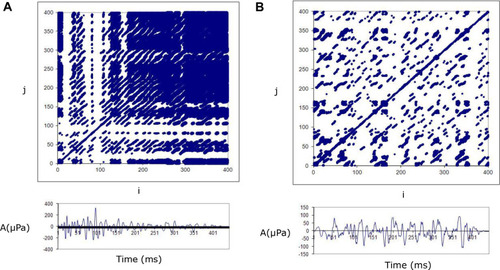
Figure 3 WWR vs RAD2 in the ARHL group.
Notes: The area is shown divided in 4 quadrants (A–D) in every quadrant it is possible to observe the points corresponding to TEOAEs with different characteristics; (for more details see the Appendix A) (A) left top, TEOAE with high WWR and low RAD2D (true negative); (B) right top, TEOAEs with both high WWR and high RAD2D (false negative), in this area the 8 points indicate 8 ears screened as pass by WWR but identified as “fail” by the new RQA-based post-processing TEOAE analysis; (C) left bottom, TEOAE with both low WWR and RAD2D (false positive); (D) right bottom, TEOAE with low WWR and high RAD2D (true positive).
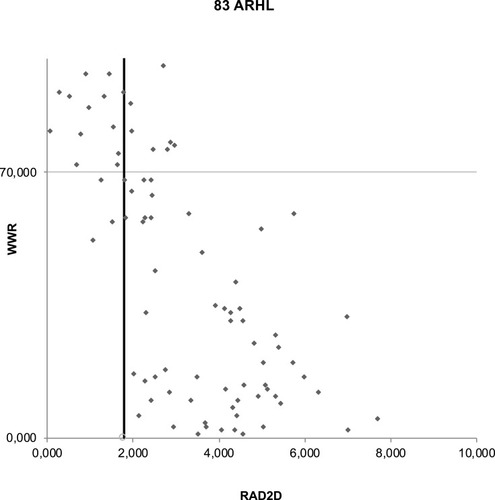
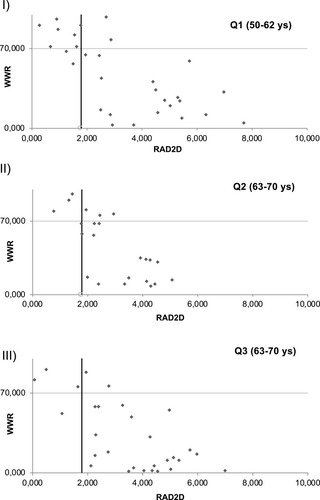
Figure 4 WWR vs RAD2 in different ARHL age groups.
Notes: The format of the figure follows the format of . The sensitivity estimates were 63% (Q1), 77% (Q2) and 88% (Q3), respectively. As it was expected the sensitivity estimate from the 3 groups increases with age.