Figures & data
Figure 1 Body weight changes and relative load capacity of trained groups during the experimental period. Values are presented as means ± SD. (A) Body weight over the 12 weeks. (B) Initial and final relative load capacity. The experimental groups were: young sedentary (YS), young trained (YT), old sedentary (OS), and old trained (OT). Statistically significant differences compared to: #young rats; *0 weeks; aYT, 0 weeks; bOT, 0 weeks; cYT, 12 weeks, p≤0.05 (n=5 per group).
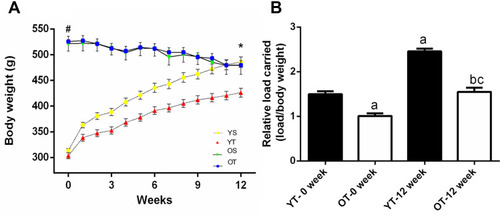
Figure 2 Optical densitometry of zymography bands of MMP-2 in the lumbar vertebra (L6). Activity was expressed in arbitrary units (AU). Values are presented as means ± SD. (A) Pro-MMP-2 (~68 kDa). (B) Intermediate MMP-2 (64 kDa). (C) Active MMP-2 (62 kDa). The experimental groups were: young sedentary (YS), young trained (YT), old sedentary (OS), and old trained (OT). Statistically significant differences compared to: aYS; bYT; cOS, p≤0.05 (n=5 per group).
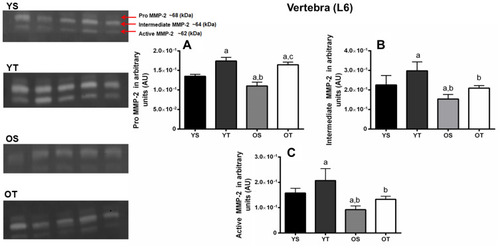
Figure 3 Optical densitometry of zymography bands of MMP-2 in the right femur. Activity was expressed in arbitrary units. Values are presented as means ± SD. (A) Pro-MMP-2 (~68 kDa). (B) Active MMP-2 (62 kDa). The experimental groups were: young sedentary (YS), young trained (YT), old sedentary (OS), and old trained (OT). No statistically significant differences between groups, p>0.05 (n=5 per group).
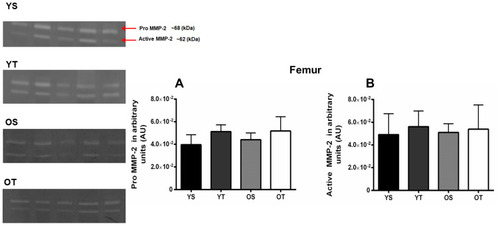
Figure 4 Optical densitometry of zymography bands of MMP-2 in the right tibia. Activity was expressed in arbitrary units (AU). Values are presented as means ± SD. (A) Pro-MMP-2 (68 kDa). (B) Intermediate MMP-2 (64 kDa). (C) Active MMP-2 (62 kDa). The experimental groups were: young sedentary (YS) young trained, (YT) old sedentary (OS), and old trained (OT). Statistically significant differences compared to: aYS; bYT; cOS, p≤0.05 (n=5 per group).
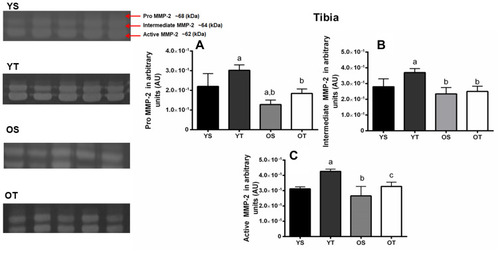
Figure 5 Optical densitometry of zymography bands of MMP-2 between lumbar vertebra, tibia, and femur. Activity was expressed in arbitrary units (AU). Values are presented as means ± SD. (A) Pro-MMP-2 (68 kDa). (B) Active MMP-2 (62 kDa). The experimental groups were: young sedentary (YS) young trained (YT), old sedentary (OS), and old trained (OT). Statistically significant differences compared to: alumbar vertebra; bfemur, p≤0.05 (n=5 per group).
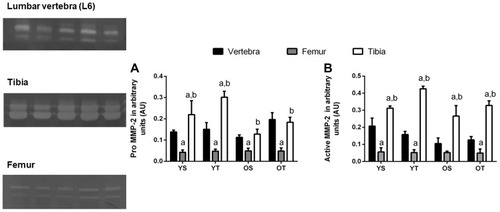
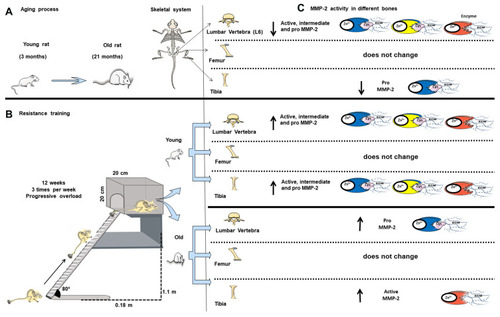
Figure 6 Overview of the aging process and resistance training on matrix metalloproteinase-2 activity in the lumbar vertebra (L6), tibia, and femur. (A) Rat model of aged rats. (B) Resistance training protocol (consisting of climbing a vertical ladder with weights secured to the tail). (C) MMP-2 activity in different bones. Blue enzyme represents pro-MMP-2; yellow enzyme represents pro-MMP-2; red enzyme represents active MMP-2. Zn2+, enzymatic cofactor ion; Cys, conserved cysteine residue that interacts with the Zn2+ in the active site; ECM, extracellular matrix; ↑ upregulated MMP-2 activity; ↓ downregulated MMP-2 activity.