Figures & data
Figure 1 (A) Sagittal computed tomography view of COLF; (B) axial computed tomography view of COLF; (C) sagittal magnetic resonance imaging of COLF; (D) axial magnetic resonance imaging of COLF; (E) sagittal computed tomography of concomitant COLF and COPLL; (F) axial computed tomography view of concomitant COLF and COPLL; (G) sagittal magnetic resonance imaging of concomitant COLF and COPLL; (H) axial magnetic resonance imaging of concomitant COLF and COPLL.
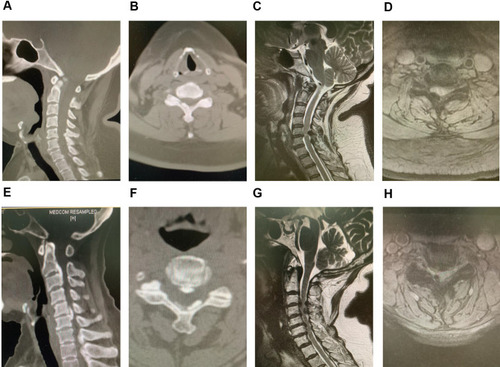
Figure 2 Flow chart of the selection of studies included in this systematic review.
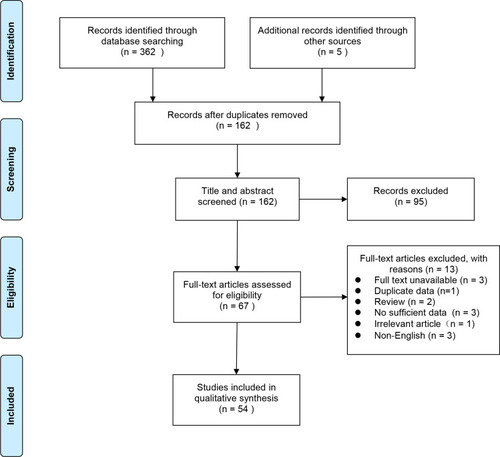
Figure 3 Literature characteristics. (A) Year of publication and number of reported articles/cases; (B) countries of publication and number of reported articles/cases; (C) regional distribution of cases.
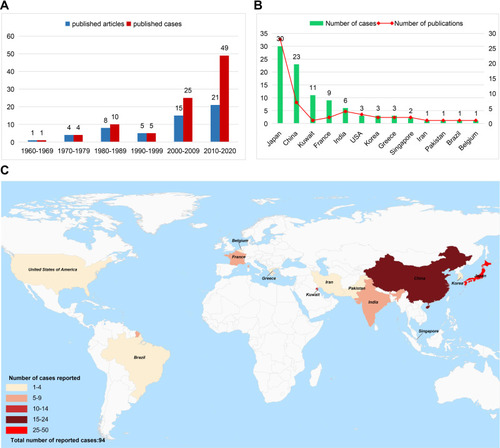
Figure 4 Epidemiological characteristics of COLF. (A) Mean age distribution of cases; (B) the number of cases in different age group; (C) gender distribution of cases; (D) racial distribution of cases.
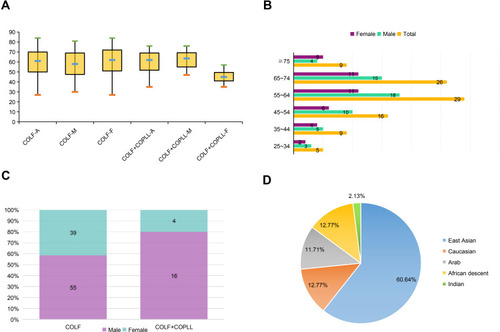
Figure 5 COLF distribution on T2-weighted sagittal MRI. (A and D) Single-segment distribution; (B and E) two-segment distribution; (C and F) multiple-segment distribution.
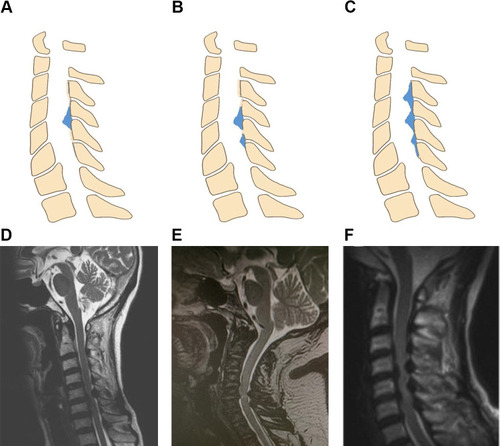
Figure 6 COLF location on Axial CT views. (A and E) Central site of the lamina; (B and F) left side of the lamina; (C and G) right side of the lamina; (D and H) bilateral side of the lamina.
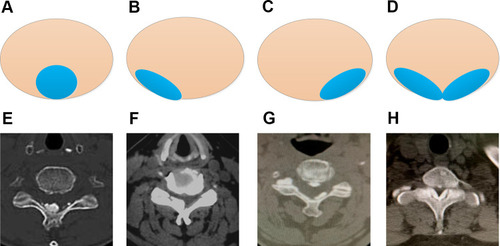
Figure 7 Radiological characteristics of COLF. (A) The proportion of single-segment distribution, two-segment distribution and multiple-segment distribution; (B) the proportion of central site of the lamina, left side of the lamina, right side of the lamina and bilateral side of the lamina; (C) segmental distribution of COLF; (D) segmental distribution of concomitant COLF and COPLL.
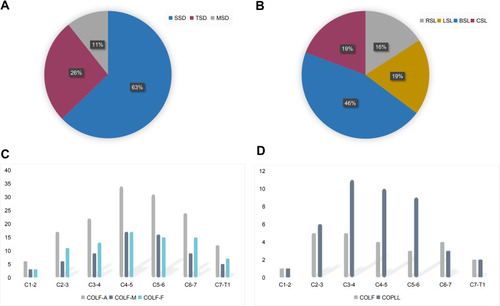
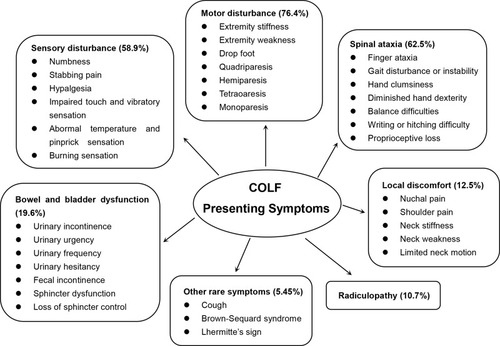
Figure 8 The category and frequency of presenting symptoms of COLF patients included.