Figures & data
Figure 1 Information of the IMU: (A) 3-axis of IMU and (B) the position of the IMU.
Abbreviations: IMU, Inertial measurement unit; VT, Vertical; ML, Mediolateral; AP, Anterior-posterior; L2, Second lumbar vertebra.
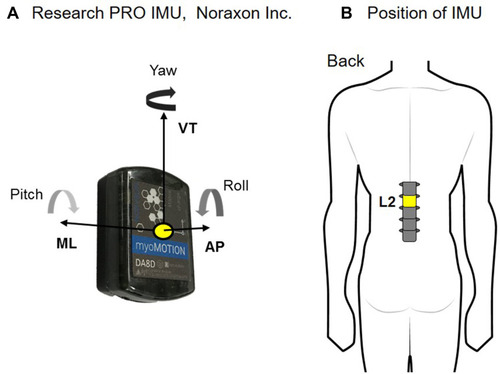
Figure 2 Experimental set-up for collecting physical data of the elderly.
Abbreviation: DXA, dual energy X-ray absorptiometry.
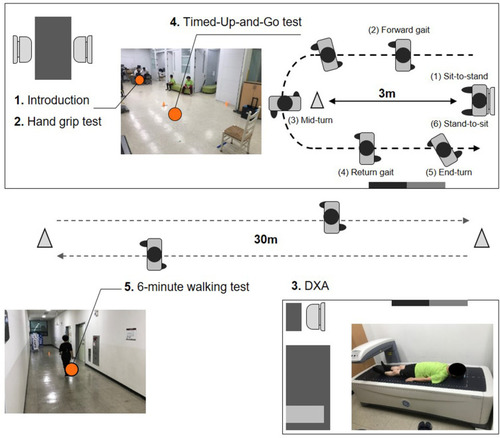
Table 1 Sarcopenia Stage Grouping, According to AWGS Criterion for Female
Figure 3 The framework of identifying the optimal classification model for predicting sarcopenia-stage.
Abbreviations: ACCVT, vertical linear acceleration; ACCAP, anterior-posterior acceleration; ACCML, mediolateral acceleration; ACCRES, resultant acceleration; YAW, Vertical axis angular velocity; ROLL, anterior-posterior axis angular velocity; PITCH, mediolateral axis angular velocity; kNN, k-nearest neighborhood algorithm; SVM, support vector machines; NB, Naïve Bayes algorithm.
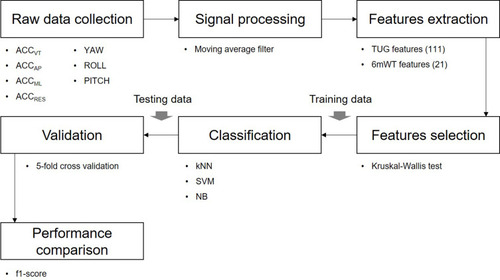
Table 2 Features of TUG
Figure 4 The example of identification the TUG sub-tasks using angular velocity.
Abbreviations: PITCH, mediolateral axis angular velocity; YAW, Vertical axis angular velocity.
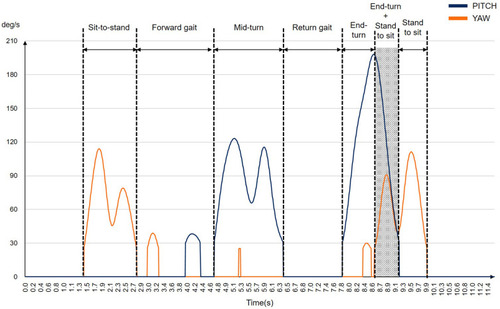
Table 3 Features of 6mWT
Table 4 Feature Selection Datasets
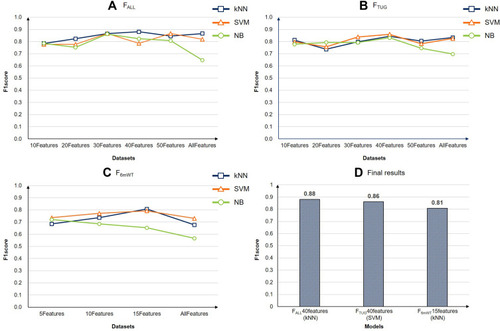
Figure 5 Classification models performance depending on feature selection datasets: (A) Results of FALL, (B) Results of FTUG, (C) Results of F6mWT, and (D) Final results.
Abbreviations: FALL, dataset consisted of both TUG features and 6mWT features; FTUG, dataset consisted of only TUG features; F6mWT, dataset consisted of only 6mWT features; kNN, k-nearest neighborhood algorithm; SVM, support vector machines; NB, Naïve Bayes algorithm; FALL40features(kNN), the kNN classification model using 40 features on FALL; FTUG40features(SVM), the SVM classification model using 50 features on FTUG;; F6mWT15features(kNN), the kNN classification model using 15 features on F6mWT.