
Figures & data
Table 1 Clinical Characteristics of Patients
Table 2 Clinical Characteristics of Patients with and without T2DM
Table 3 Clinical Characteristics of Patients with and without Diabetic Microvascular Complications
Figure 1 The association between trace elements and oxidative stress levels in elderly diabetic patients Matrix heatmap showed Spearman correlation coefficient values for all study parameters. Negative correlations are blue, positive correlations are red, and white indicates no association between variables. *P<0.05, **P<0.01.
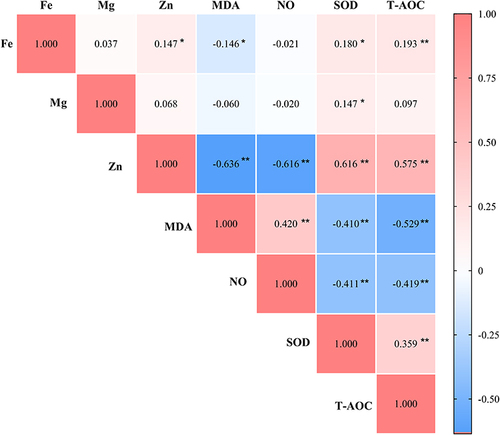
Table 4 Logistic Regression Analysis of the Severity of Microvascular Complications in Elderly Diabetic Patients
Table 5 Risk Factors for the Severity of Microvascular Complications in Elderly Diabetic Patients
Data Sharing Statement
The datasets generated and analysed during the current study are not publicly available but are available from the corresponding author on reasonable request.