
Figures & data
Figure 1 Percentage of falls risk based on PPA category of falls risk.
Abbreviation: PPA, profile physiological assessment.
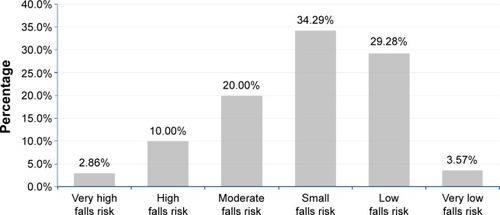
Table 1 Demographic data of participants
Table 2 Spearman’s rho correlation of the variables
Table 3 Physical performance tests as predictors of physiological falls risk
Table 4 Coordinates of the curve
Table 5 Area under the ROC for static balance test measuring postural sways as a predictor for physiological falls risk