
Figures & data
Table 1 Baseline characteristics of the study population
Figure 1 Flow diagram of the study.
Notes: Comparison between the left and right radial approach for primary coronary intervention in patients with ST-elevation myocardial infarction.
Abbreviation: n, number.
Abbreviation: n, number.
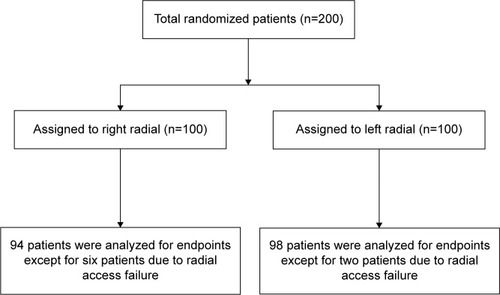
Table 2 Angiographic and interventional characteristics of the study population
Table 3 Procedural durations and radiation exposure of the study population