Figures & data
Table 1 Population Characteristics Separated by Contact Type, N= 2,374,673
Figure 1 Forest plot of the ratio of contact rates for each sociodemographic variable, adjusted IRR 95% CI, N=2,374,673.
Notes: Missing values in variables education level (151,162) and socioeconomic classification (168); thus analyses only included 1,932,196 and 2,374,505 individuals for the two variables.
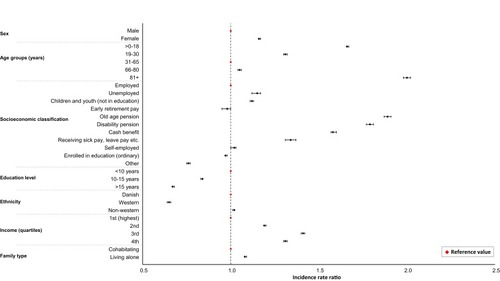
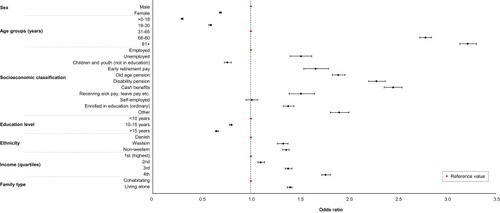
Figure 2 Forest plot of the association between sociodemographic variables and adjusted odds ratios for EMS vs OOH-PC, OR 95% CI, N=619,857.
Notes: Missing values in variables education level (151,162) and socioeconomic classification (26); thus analyses only included 468,695 and 619,831 individuals for the two variables.