
Figures & data
Figure 1 Preferred reporting items for systematic reviews and meta-analyses flowchart describing the literature search strategy and study selection.
Abbreviations: AML, acute myeloid leukemia; MDS: myelodysplastic syndromes.
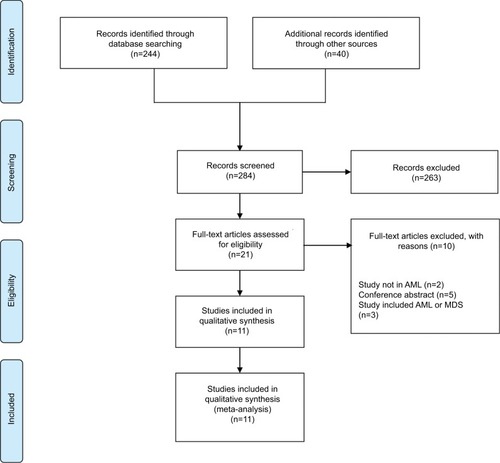
Table 1 Characteristics of the studies included in this meta-analysis
Figure 2 Forest plot of the estimated proportions (95% CI) for overall response rate (ORR) in acute myeloid leukemia (AML) patients treated with lenalidomide.
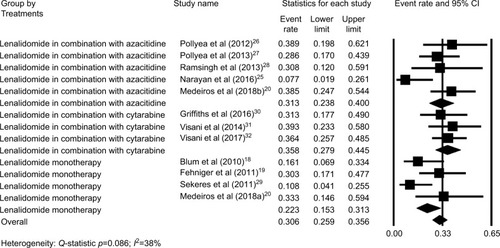
Figure 3 Forest plot of the estimated proportions (95% CI) for complete remission (CR) in acute myeloid leukemia (AML) patients treated with lenalidomide.
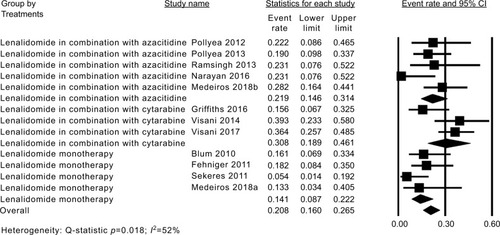
Figure S1 Forest plots of the estimated proportions of grade 3 and 4 adverse events ([A] anemia, [B] thrombocytopenia, [C] neutropenia, and [D] neutropenic fever).
![Figure S1 Forest plots of the estimated proportions of grade 3 and 4 adverse events ([A] anemia, [B] thrombocytopenia, [C] neutropenia, and [D] neutropenic fever).](/cms/asset/fbc8d863-238d-4380-930c-088e57e3e74c/dcmr_a_12185606_sf0001_b.jpg)
Figure S2 Forest plots of the estimated proportions of grade 3 and 4 adverse events ([A] infectious, [B] fatigue, and [C] electrolyte disturbance).
![Figure S2 Forest plots of the estimated proportions of grade 3 and 4 adverse events ([A] infectious, [B] fatigue, and [C] electrolyte disturbance).](/cms/asset/4c8573d0-1e3d-44fa-a53c-c2083c793692/dcmr_a_12185606_sf0002_b.jpg)
Figure S3 Forest plots of subgroup analysis of acute myeloid leukemia (AML) type ([A] untreated patients, [B] relapsed/refractory patients).
![Figure S3 Forest plots of subgroup analysis of acute myeloid leukemia (AML) type ([A] untreated patients, [B] relapsed/refractory patients).](/cms/asset/597b73f1-c7db-4514-a3c6-146e9f40e53d/dcmr_a_12185606_sf0003_b.jpg)
Figure S4 Forest plots of subgroup analysis of cytogenetic risk ([A] intermediate-risk patients, [B] unfavorable-risk patients).
![Figure S4 Forest plots of subgroup analysis of cytogenetic risk ([A] intermediate-risk patients, [B] unfavorable-risk patients).](/cms/asset/c4d1069f-b15f-4c9e-aa75-4fbca5e63fa6/dcmr_a_12185606_sf0004_b.jpg)
Table S1 Assessment of study quality using a modified version of the Newcastle-Ottawa scale for cohort studies