Figures & data
Figure 1 Flow diagram of the analysis procedure: data collection, preprocessing, analysis, and validation.
Abbreviations: DEGs, differentially expressed genes; ROC, receiver operating characteristic; TCGA, The Cancer Genome Atlas.
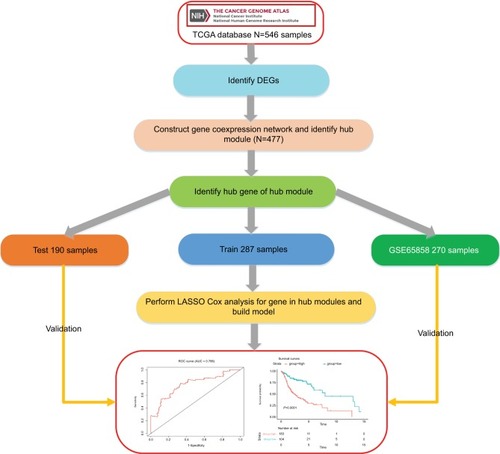
Figure 2 Identification of modules associated with the clinical traits of HNSCC.
Notes: (A) Distribution of average GS and errors in the modules associated with progression of HNSCC. (B) Heatmap of the correlation between MEs and clinical traits of HNSCC.
Abbreviations: GS, gene significance; HNSCC, head and neck squamous cell carcinoma; ME, module eigengene.
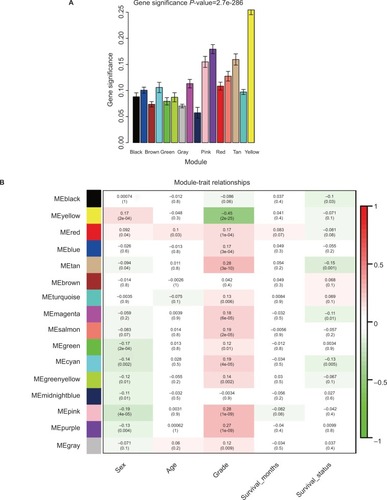
Figure 3 The risk score performance in the training data sets.
Notes: (A-F) The survival plot and the 5-year survival ROC curve of OS, DSS, and PFS. (G–I) The relationship between risk score, survival information, and z-score transformed expression values are shown (top-down, FOXL2NB, PCOLCE2, SPINK6, ULBP2, KCNJ18, and RFPL1).
Abbreviations: AUC, area under the curve; DSS, disease-specific survival; OS, overall survival; PFS, progression-free survival; ROC, receiving operating characteristic.
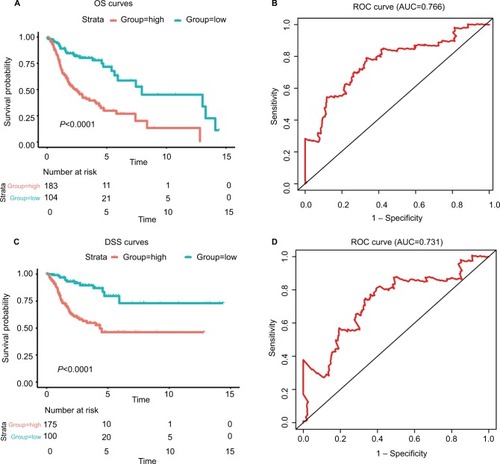
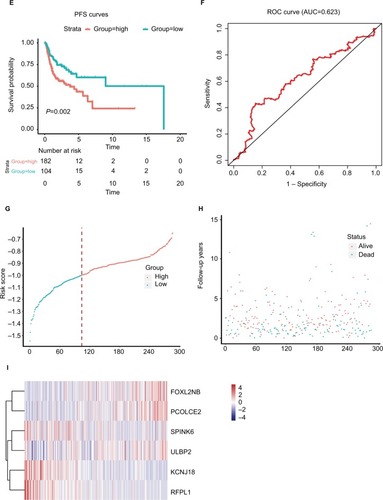
Table 1 Association of the six-mRNA signature with clinicopathological characteristics in HNSCC patients (n=477)
Table 2 Univariable and multivariable Cox regression analyses of the six-mRNA signature and survival of HNSCC patients in the training, test, and entire group
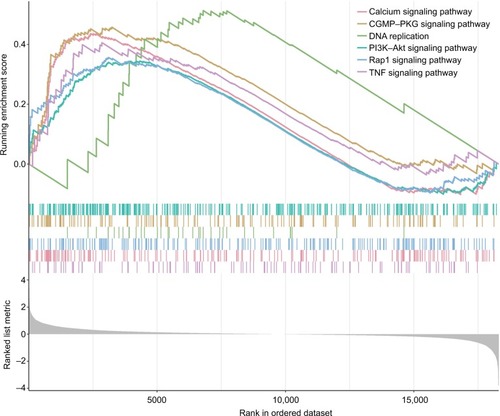
Figure 4 GSEA performed identify the potential pathways that differentiate the high-/low-risk groups.
Note: The graphs depict only the six common functional gene sets enriched in HNSCC samples.
Abbreviations: GSEA, gene set enrichment analysis; HNSCC, head and neck squamous cell carcinoma.