
Figures & data
Figure 1 Hierarchical clustering and heat map analysis of differentially expressed lncRNAs (A), miRNAs (B), and genes (C).
Notes: Each row represents a sample, and each column represents an lncRNA, miRNA, or gene. High- or low-relative expression is displayed as a red or blue strip, respectively. Each group contained 20 different samples.
Abbreviations: T, tumor; N, normal.
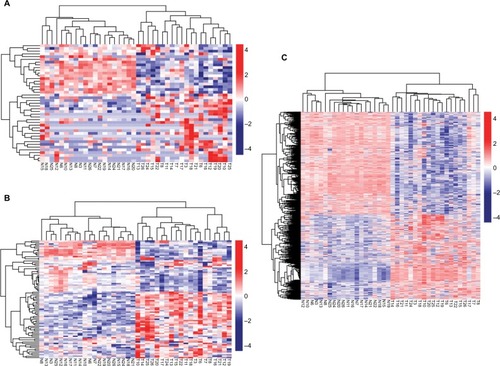
Table 1 Differentially expressed genes, miRNAs, and lncRNAs
Figure 2 Function enrichment analyses for the differentially expressed genes.
Note: (A) GO enrichment and (B) KEGG pathways enrichment.
Abbreviations: GO, Gene Ontology; KEGG, Kyoto Encyclopedia of Genes and Genomes.
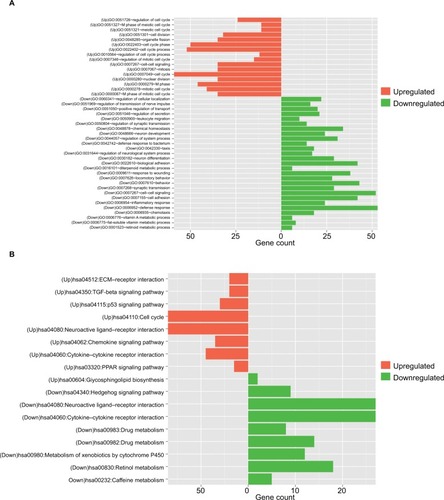
Table 2 GO enrichment for differentially expressed genes using the DAVID database
Table 3 KEGG pathway enrichment for differentially expressed genes using the DAVID database
Figure 3 Protein and protein interaction network for the differentially expressed genes.
Notes: Red, upregulated; green, downregulated. The larger size of node (protein) indicates the higher degree (interaction relationships) of it.
Abbreviation: FC, fold change.
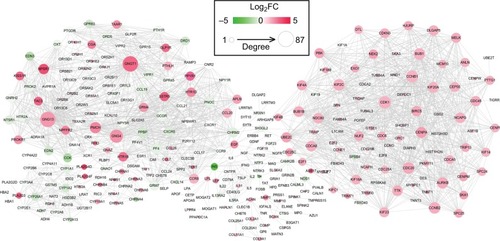
Figure 4 Modules extracted from the protein and protein interaction network.
Notes: (A) module 1; (B) module 2; (C) module 3; and (D) module 4. Red, upregulated; green, downregulated. The larger size of node (protein) indicates the higher degree (interaction relationships) of it.
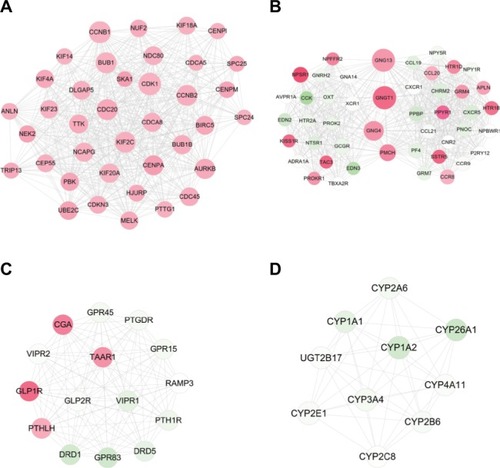
Table 4 Topological features for each protein in PPI network
Table 5 BinGO enrichment for genes in modules
Figure 5 ceRNAs interaction network of lncRNA–miRNA–mRNA.
Notes: Square nodes represent lncRNAs; triangle nodes represent miRNAs; circular nodes represent mRNAs. Red, upregulated; green, downregulated.
Abbreviation: FC, fold change.
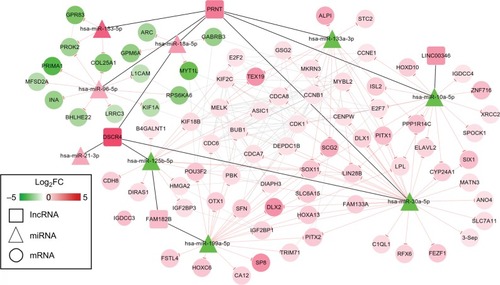
Figure 6 HCC-related ceRNAs interaction network of lncRNA–miRNA–mRNA.
Notes: Square nodes represent circRNAs, triangle nodes represent miRNAs, circular nodes represent mRNAs, and rhombus nodes represent HCC pathways. Red, upregulated; green, downregulated.
Abbreviations: FC, fold change; HCC, hepatocellular carcinoma.
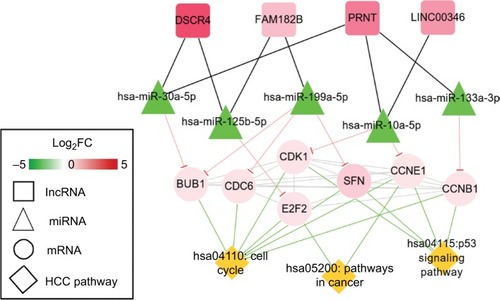
Table 6 KEGG pathways for genes in ceRNA network
Figure 7 Kaplan–Meier analysis to display the correlation of differentially expressed lncRNAs (A), miRNAs (B), and genes (C) with overall survival outcomes for patients with HBV-related HCC.
Abbreviations: HBV, hepatitis B virus; HCC, hepatocellular carcinoma.
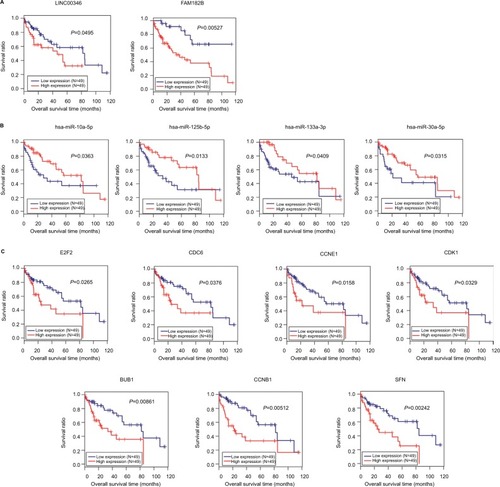
Figure 8 Kaplan–Meier analysis to display the correlation of differentially expressed genes with recurrence-free survival outcomes for patients with HBV-related HCC.
Abbreviations: HBV, hepatitis B virus; HCC, hepatocellular carcinoma.
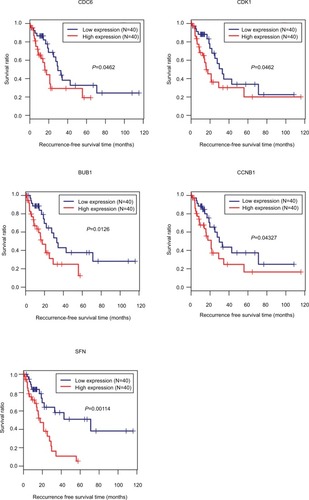
Table 7 Cox regression analysis to screen survival-related genes
Table 8 Confirmation of expressions of crucial lncRNAs, miRNAs, and mRNAs using other datasets