Figures & data
Figure 1 The effect of atractylon on hepatic cancer cell proliferation. (A) The cell viability of atractylon on HepG2, LM3, and MHCC97H cells at 0, 5, 10, and 20 μM. (B) The inhibition rate of atractylon on HepG2, LM3, and MHCC97H cells at 0, 5, 10, and 20 μM. (C) The IC50 value of atractylon on HepG2, LM3, and MHCC97H cells. (D) The colony formation inhibition of atractylon (0, 5, 10, 20 μM) on HepG2, LM3, and MHCC97H cells for 2 weeks. The surviving colonies >10 cells were counted. *P<0.05, **P<0.01, ***P<0.001.
Abbreviation: ns, not significant.
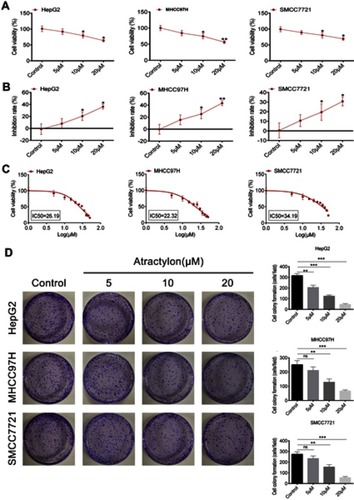
Figure 2 The effect of atractylon on hepatic cancer cell apoptosis and apoptosis-associated protein expression. (A) The apoptosis rate of HepG2 and MHCC97H cells that treatment with atractylon (0, 5, 10, 20 μM) for 24 h was determined by flow cytometry. (B) The expression of Bcl-2, Bax, and cleaved caspase-3 in HepG2 and MHCC97H cells that treatment with atractylon (0, 5, 10, 20 μM) for 24 h was detected by Western blot. (C) The expression of ATP5A and GAPDH in the mitochondrial (Mito) and cytosolic (Cyt) fractions that isolated from the cells was determined by Western blot. (D) The expression of Bcl-2 and Bax in the mitochondrial (Mito) was determined by Western blot. *P<0.05, **P<0.01, ***P<0.001.
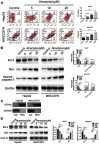
Figure 3 Atractylon induces losing of mitochondrial membrane potential (∆Ψm) and increasing ROS. (A) The mitochondrial membrane potential (∆Ψm) of HepG2 and MHCC97H cells that were treated with atractylon (0, 5, 10, 20 μM) was determined by flow cytometry. (B) The intracellular ROS level of HepG2 and MHCC97H cells after treatment with atractylon (0, 5, 10, 20 μM) was determined by 2,7-Dichlorodi-hydrofluorescein diacetate (DCFH-DA) method. *P<0.05, **P<0.01, ***P<0.001.
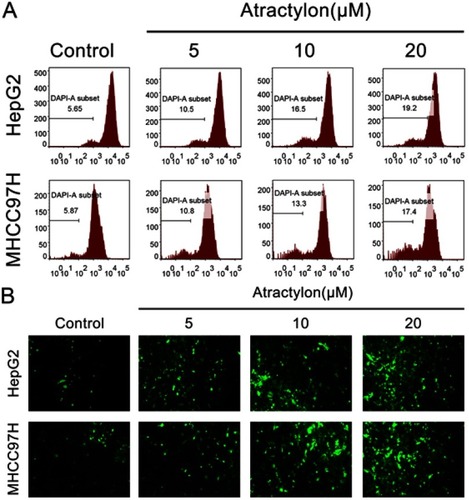
Figure 4 Atractylon inhibits HepG2 and MHCC97H cell migration and invasion. (A) The migration ability of HepG2 and MHCC97H cells that were treated with atractylon (0, 5, 10, 20 μM) was determined by the Transwell chamber. (B) The invasion ability of HepG2 and MHCC97H cells that were treated with atractylon (0, 5, 10, 20 μM) was determined by the Transwell chamber. (C) The expression of MMP-2, MMP-9, and TIMP2 in HepG2 and MHCC97H cells that were treated with atractylon (0, 5, 10, 20 μM) was detected by Western blot. (D) The expression of EMT markers (E-cadherin, N-cadherin, Vimentin, and α-SMA) in HepG2 and MHCC97H cells that were treated with atractylon (0, 5, 10, 20 μM) was detected by Western blot. *P<0.05, **P<0.01, ***P<0.001.
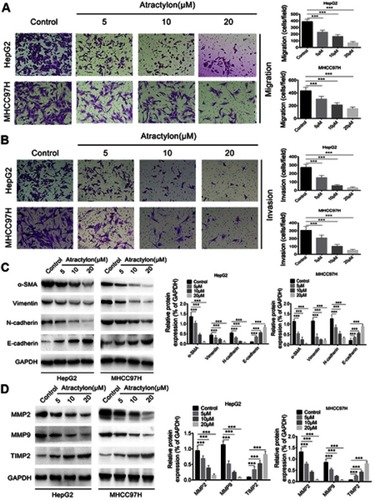
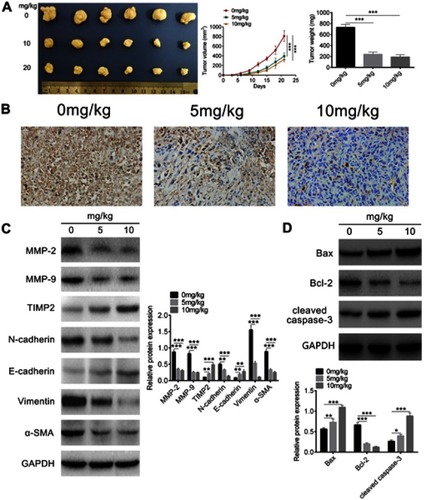
Figure 5 The antitumor effect of atractylon in vivo. (A) A in vivo hepatic cancer tumor mouse model was established by implanting subcutaneously with 100 μl HepG2 cell suspensions (1×10⁷ cells/mouse) into the left dorsal. The tumor volume was measured every 3 days, the tumor tissues were excised, photographed, and weighed at the end. (B) The expression of Ki-67 in the tumor sections was detected by IHC staining (20×). (C) The expression of MMP-2, MMP-9, TIMP2, E-cadherin, N-cadherin, Vimentin, and α-SMA in xenograft tumor tissues was detected by Western blot. (D) The expression of Bcl-2, Bax, and cleaved caspase 3 in xenograft tumor tissues was detected by Western blot. *P<0.05, **P<0.01, ***P<0.001.