Figures & data
Table 1 The primers used in this study
Table 2 Correlation between the expression level of HOXA11-AS and the clinicopathological features of OS
Table 3 The correlation between the expression level of miR-125a-5p and the clinicopathological features of OS
Table 4 The correlation between the expression level of Rab3D and the clinicopathological features of OS
Figure 1 RT-PCR results of HOXA11-AS expression in OS tissues and cell lines. (A) The expression level of HOXA11-AS in tumor tissues and the adjacent tissues (**P<0.01, n=61); (B) HOXA11-AS expression level in OS cell lines and normal human osteoblasts (*P<0.05); (C) The Kaplan–Meier curves by HOXA11-AS expression levels. Patients with high HOXA11-AS expression had a poor overall survival compared to those patients with low HOXA11-AS expression (log-rank test; P=0.007) (n=61).
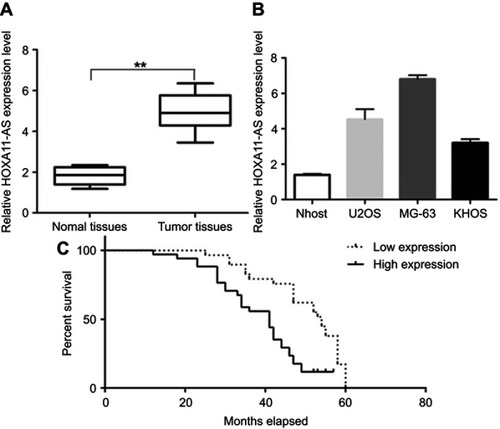
Figure 2 HOXA11-AS promotes the proliferation of OS. (A) Down-regulation of HOXA11-AS expression in MG-63 cells could inhibit cell proliferation, while up-regulation of HOXA11-AS expression could promote cell proliferation *P<0.05,**P<0.01. (B) Down-regulation of HOXA11-AS expression in KHOS cells could inhibit cell proliferation, while up-regulation of HOXA11-AS expression could promote cell proliferation *P<0.05,**P<0.01. (C) Down-regulation of HOXA11-AS expression in MG-63 cells could inhibit the growth of subcutaneous solid tumors in nude mice, while up-regulation of HOXA11-AS expression could promote the growth of subcutaneous solid tumors in nude mice. (D) Changes of tumor volume with time after inoculation of MG-63 cells of different groups **P<0.01. (E) Down-regulation of HOXA11-AS expression in KHOS cells could inhibit the growth of subcutaneous solid tumors in nude mice, while up-regulation of HOXA11-AS expression could promote the growth of subcutaneous solid tumors in nude mice. (F) Changes of tumor volume with time after inoculation of MG-63 cells of different groups.
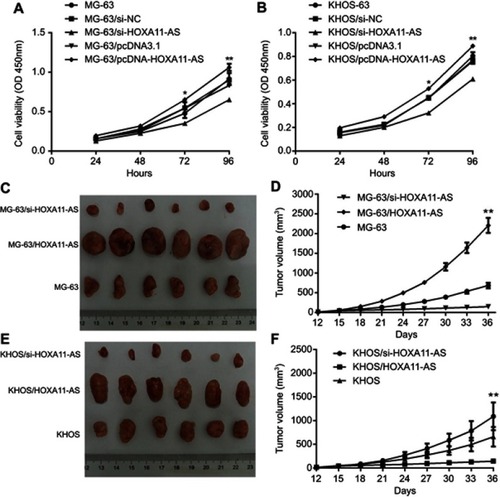
Figure 3 HOXA11-AS could promote the migration and invasion of OS. (A) The HOXA11-AS expression level decreased significantly in MG-63 cells after HOXA11-AS siRNA was transfected into cells (**P<0.01); The HOXA11-AS expression level increased significantly in KHOS cells after pcDNA-HOXA11-AS was transfected into cells (**P<0.01). (B) The invasion ability of MG-63 cells decreased significantly after HOXA11-AS siRNA inhibited HOXA11-AS expression, the invasion of KHOS cells increased significantly after KHOS cells overexpressed HOXA11-AS (**P<0.01). (C) The migration ability of MG-63 cells decreased significantly after HOXA11-AS siRNA inhibited HOXA11-AS expression, the migration of KHOS cells increased significantly after KHOS cells overexpressed HOXA11-AS (**P<0.01).
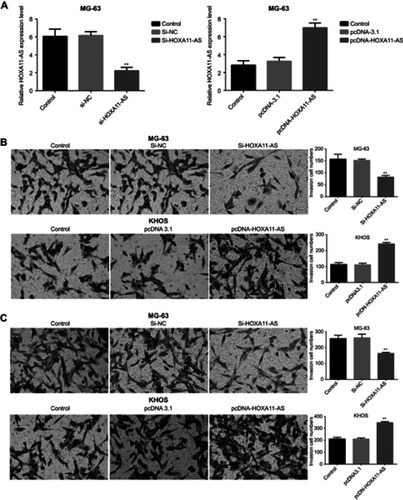
Figure 4 HOXA11-AS could directly regulate the expression of miR-125-5p. (A) Construction of WT-HOXA11- AS and Mut-HOXA11-AS. (B) RT-PCR results showed that the expression level of miR-125a-5p in OS tissues was significantly lower than that in their adjacent tissues (**P<0.01). (C) Inhibiting the expression of HOXA11-AS in MG-63 cells could significantly increase the expression level of miR-125a-5p (**P<0.01). (D) Overexpression of HOXA11-AS in KHOS cells could significantly inhibit the expression of miR-125a-5p (**P<0.01).
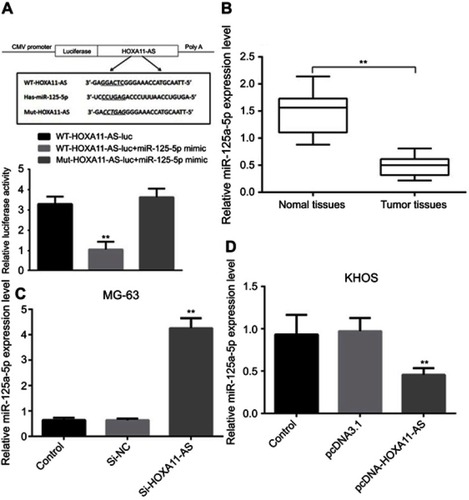
Figure 5 HOXA11-AS promotes the invasion and migration of OS through competitive binding with miR-125a-5p. (A, E) Inhibition of miR-125-5p expression could counteract the ability of HOXA11-AS- siRNAs to inhibit cell migration (*P<0.05, **P<0.01). (B, G) Up-regulation of miR-125-5p expression could inhibit the promoting effect of HOXA11-AS overexpression on migration of KHOS cells (*P<0.05, **P<0.01). (C, F) Inhibition of miR-125-5p expression could counteract the ability of HOXA11-AS- siRNAs to inhibit cell invasion (*P<0.05, **P<0.01). (D, H) Up-regulation of miR-125-5p expression could inhibit the promoting effect of HOXA11-AS overexpression on invasion of KHOS cells (**P<0.01).
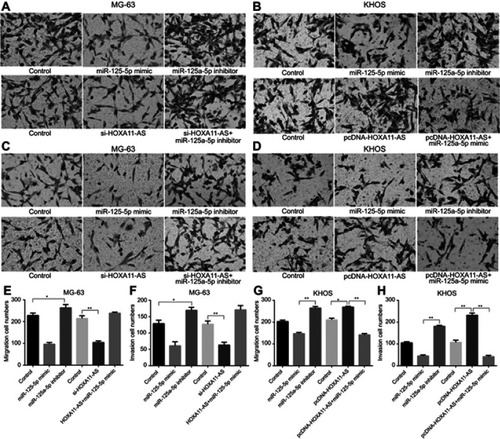
Figure 6 HOXA11-AS could up-regulate the expression of its target gene Rab3D by down-regulating miR-125a-5p expression. (A) Immunohistochemical results showed that the expression level of Rab3D in tumor tissues was higher than that in their adjacent tissues. (B) RT-PCR results showed that the expression level of Rab3D in tumor tissues was significantly higher than that in their adjacent tissues (**P<0.01). (C) The TargetScan software analysis showed that miR-125a-5p may be combined with 3 ‘UTR of Rab3D. (D) Luciferase reporter gene analysis showed that miR-125a-5 could target the 3’UTR of Rab3D (**P<0.01). (E, F) miR-125a-5p could inhibit the expression of Rab3D in OS cell lines (*P<0.05, **P<0.01). (G, H) HOXA11-AS could promote the expression of Rab3D by inhibiting the expression of miR-125a-5p in OS cell lines (*P<0.05, **P<0.01).
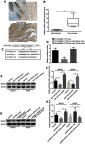
Figure 7 Rab3D can promote the migration and invasion of OS. (A) The proliferation of MG-63 cells decreased after down-regulation of Rab3D expression *P<0.05,**P<0.01. (B) The proliferation of KHOS cells decreased after down-regulation of Rab3D expression *P<0.05,**P<0.01. (C) The migration and invasion of MG-63 cells were inhibited after down-regulation of Rab3D expression (**P<0.01). (D) The migration and invasion of KHOS cells were inhibited after down-regulation of Rab3D expression (**P<0.01).
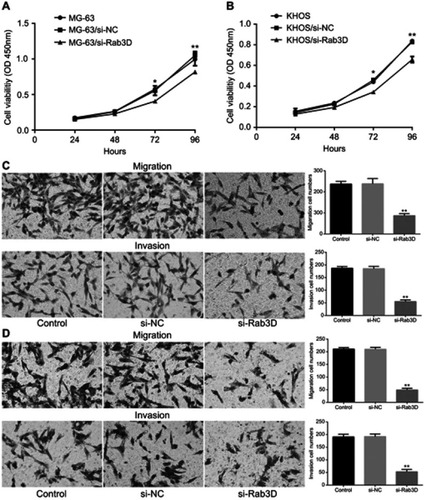
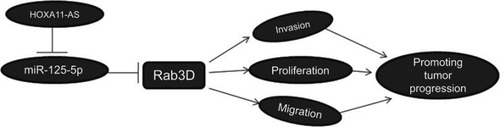
Figure 8 Schematic diagram of HOXA11-AS/miR-125a-5p/Rab3D signal axis regulating OS invasion.