
Figures & data
Table 1 Antibody information used in this study is summarized
Table 2 Expression levels of α2δ1 and CD44 are analyzed in gastric cancer cell lines
Figure 1 Expression levels of α2δ1 were different in gastric cancer cell lines, PDX models and ascites samples. (A) Representative images illustrating the expression of α2δ1 in HGC-27 cell line, MKN45 cell line and ascites sample (Case 1) detected using confocal microscope. Merged images showed α2δ1 expressed on the cell membranes of cells. (B) Flow cytometry analysis showed α2δ1 expressed differently in nine gastric cancer cell lines. (C) Western blotting analysis was conducted to investigate the expression of α2δ1 in gastric cancer cell lines. Results showed α2δ1 expressed at different levels in the nine tested cell lines. (D) Flow cytometry analysis showed α2δ1 expressed differently in six gastric cancer cell PDX models. (E) Flow cytometry analysis showed α2δ1 expressed differently in 10 clinical samples of ascites of gastric cancer patients (Cases 1–10). Scale bar: 100 µm.
Abbreviations: PDX, patient-derived xenograft; FITC, fluorescein isothiocyanate; PE, phycoerythrin.
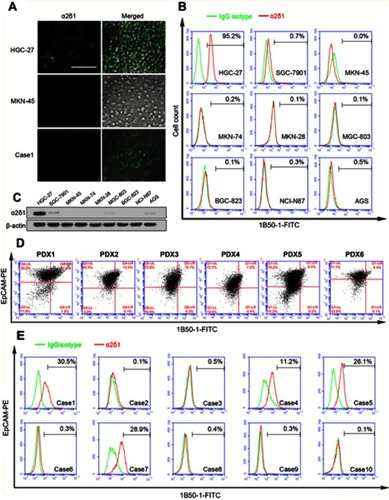
Table 3 Ratio of MFI between α2δ1 versus control in ascites samples of gastric cancer patients
Table 4 α2δ1+ HGC-27 and α2δ1+ SGC-7901 cells possess highly tumorigenic capacity
Figure 2 α2δ1+ HGC-27 and α2δ1+ SGC-7901 cells displayed cancer stem cell properties. (A) Comparison of tumor formation frequency of purified α2δ1+ and α2δ1− cells in NOD/SCID mice. α2δ1+ cells displayed significant tumorigenic capacity. (B) Comparison of sphere-formation frequency of purified α2δ1+ and α2δ1− cells in vitro. α2δ1+ cells displayed significant sphere-forming capacity. α2δ1+ cells sorted from the sphere formed previously continued to display high sphere-forming capacity after subsequent propagation. (C) Comparison of differentiation potential of α2δ1+ and α2δ1− cells in vitro. Purified α2δ1+ cells were cultured in vitro for 2 weeks, and the percentage of α2δ1+ cells decreased to the value similar to that of the unsorted parental cells. Purified α2δ1− cells were cultured in vitro under the same condition for the same period, and the percentage of α2δ1+ cells remained extremely low in the post-cultured α2δ1− cells. *p<0.05. Scale bar: 100 µm.
Abbreviation: FITC, fluorescein isothiocyanate.
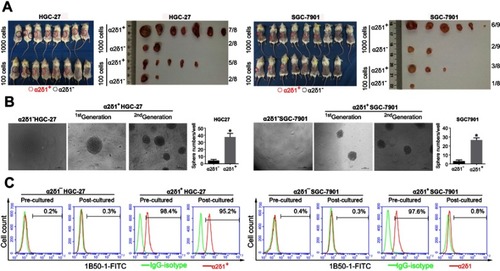
Figure 3 α2δ1+ HGC-27 cells presented more significant invasiveness than α2δ1− HGC-27 cells. Comparison of invasiveness of α2δ1+ and α2δ1− HGC-27 cells using the transwell assays. The purified α2δ1+ and α2δ1− HGC-27 cells were cultured separately in the transwell chambers for 24 hrs. The cells that had migrated through the membrane were stained and counted. α2δ1+ HGC-27 cells displayed more invasiveness than their α2δ1− counterparts. *p<0.05.
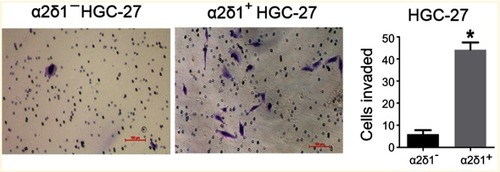
Figure 4 α2δ1 is more specific than CD44 in identifying gastric cancer stem cells. (A) Coexpression analysis of α2δ1 and CD44 in gastric cancer cell lines by flow cytometry. α2δ1+ cells account for a fraction of CD44+ cells. (B) Coexpression analysis of α2δ1 and CD44 in HGC-27 and MKN-45 cell lines by confocal microscope. (C) Comparison of sphere-formation frequency of purified α2δ1+CD44+ and α2δ1−CD44+ HGC-27 cells in vitro. α2δ1+CD44+ cells displayed significantly higher sphere-forming capacity compared with their α2δ1−CD44+ counterparts. *p<0.05.
Abbreviations: FITC, fluorescein isothiocyanate; APC, allophycocyanin.
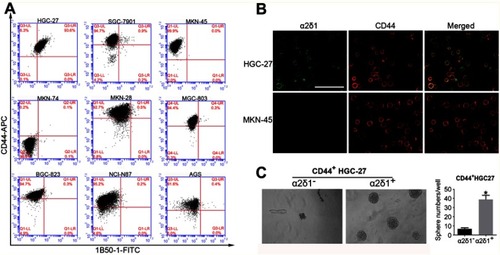
Figure 5 Knockdown of α2δ1 inhibited cancer stem cell properties of α2δ1+ HGC-27 cells. (A) Western blotting showed the difference of α2δ1, CD44 and ALDH expression between unmediated α2δ1+ HGC-27 cells (NC) and shα2δ1 HGC-27 cells. α2δ1 was confirmed downregulated in shα2δ1 HGC-27 cells, while CD44 and ALDH remained at the same level. (B) Comparison of tumor-formation frequency of unmediated α2δ1+ HGC-27 cells (NC) and shα2δ1 HGC-27 cells in NOD/SCID mice. The tumorigenic capacity was significantly inhibited after α2δ1 was knocked down. (C) Comparison of sphere-formation frequency of unmediated α2δ1+ HGC-27 cells (NC) and shα2δ1 HGC-27 cells in vitro. The sphere-formation capacity was significantly inhibited after α2δ1 was knocked down. (D) Comparison of IC50 between unmediated α2δ1+ HGC-27 cells (black) and shα2δ1 HGC-27 cells (red) when treated with cisplatin. *p<0.05.
Abbreviation: NC, negative control; CDDP, cisplatin.
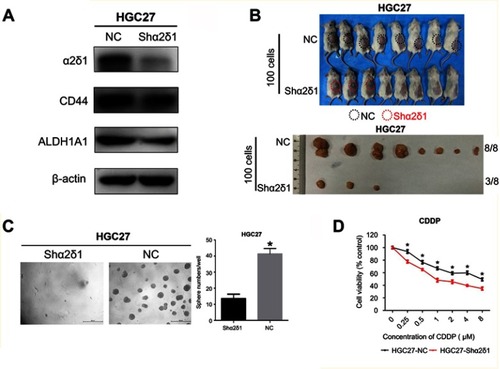
Table 5 The tumorigenic capacity of α2δ1+ HGC-27 cells are inhibited after α2δ1 knockdown
Figure S1 α2δ1+ HGC-27 cells displayed significant tumorigenic capacity after subsequent transplantation. α2δ1+ and α2δ1− HGC-27 cells were isolated from the tumors formed previously by the α2δ1+ cells in the first generation and inoculated subcutaneously into NOD/SCID mice with limiting dilution. As few as 100 α2δ1+ HGC-27 cells successfully initiated tumor formation in NOD/SCID mice, whereas their α2δ1− cell counterparts remained extremely lowly tumorigenic within the same observation period.
Abbreviation: NOD/SCID, nonobese diabetic-severe combined immune deficient.
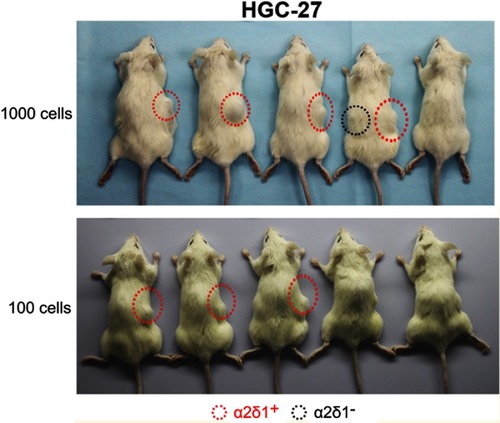
Table S1 α2δ1+ HGC-27 cells displayed significant tumorigenic capacity after subsequent transplantation