
Figures & data
Figure 1 T/C and percent tumor growth. Experimental example to illustrate the concepts of T/C (A) and %Gr (%GrI) (B). Tumor growth curves of untreated control ((C(t), blue) or treated tumors (T(t), red) are shown as tumor volume (or mass) relative to the volume (mass) at the start of treatment, over time, in days from the treatment start. Black arrows indicate treatment days. (A) The T/C ratio is calculated at all measurement times (93% on day 4, 68% on day 7, etc.). The lowest value (“best T/C” or simply “T/C”) is perceived as a measure of the percentage of cells surviving the treatment. This implicitly assumes that i) the effects of treatment are exhausted at the time of the best T/C; ii) only survivors contribute to the tumor volume at that time; and iii) survivors expand unaffected by treatment, with the same growth law as controls (S(t) = S C(t), where S is the fraction of survivors). The dashed line represents the putative growth curve of surviving cells. (B) %Gr (%GrI) is calculated from the ratio of the volume increments in treated and control samples between the start (day 0) and end (day 15) of treatment. %Gr is indicative of the growth rate reduction during treatment, ranging from 100% (no effect) to 0% (complete arrest). A different formula may be used in case of tumor regression (negative %Gr, see text). The dashed line represents the tumor volume at the start of treatment.
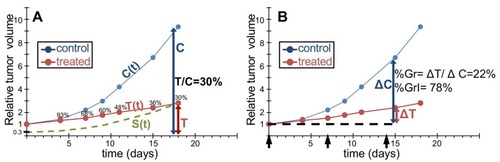
Figure 2 Different responses to treatment with the same T/C score. An example of tumor growth curve of a human xenograft growing in mice and treated (q7dx3) with an anticancer drug active on this tumor (A), with T/C 30% (see ), and three hypothetical examples giving the same T/C: a single dose with a purely cytotoxic drug where a fraction of cells is killed but survivors’ growth is unperturbed (B); a purely cytostatic drug repeatedly given to arrest proliferation until treatment is discontinued (C); a very active drug causing tumor regression (D). All treatment examples (red) share the same untreated control (blue).
Abbreviation: AGD, Absolute growth delay.
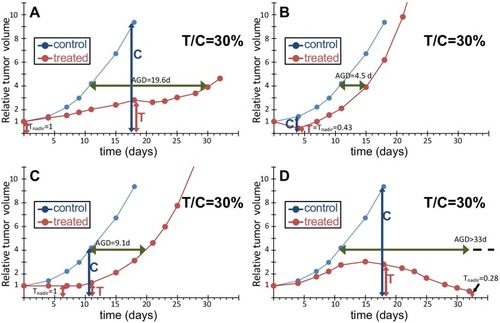
Figure 3 The same response to treatment with different T/C scores. Hypothetical examples of a simple cytostatic treatment in a fast (A) or slow (B) growing tumor model. Blue circles, untreated control; red circles, treatment. We assume that the treatment causes total growth arrest for 11 days in both cases, then tumors re-grow as if untreated. The difference in T/C values depends solely on the different denominator (“C”) and not the treatment.
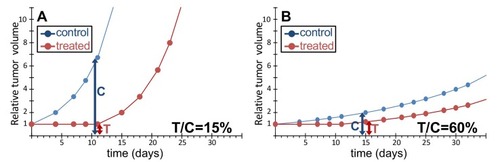
Figure 4 Two example experiments. Time courses of tumor size in untreated control (blue line, average of six mice) and in individual mice treated with different drugs and doses (red, green and violet lines). (A) data from an experiment comparing different schedules of a cytotoxic drug in an ovarian cancer model; (B) data from an experiment comparing a new drug (red line) with two dosages of another drug (green and violet lines) in a myxoid liposarcoma model. See for the values of the scores T/C, %Gr, Tnadir and AGD.
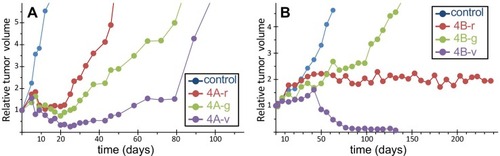
Table 1 Main Scores In The Case Examples Shown In and
Table 2 Main Scores In The Representative Experiments Shown In