Figures & data
Figure 1 C086, gefitinib, and the combinations physically binds to the Hsp90 and disrupts its Hsp90 chaperone function. (A) Chemical structure of C086, 4-(4-hydroxy-3-methoxy-phenyl-methyl) curcumin. (B) The fluorescence quenching spectra of Hsp90 with C086 (ranging from 5.0 to 50 μmol/L) and gefitinib as single agents or in combinations at different concentration. The concentration of Hsp90 was fixed at 5.0 μmol/L, and the ratio of C086, gefitinib, and the combinations vs Hsp90 was from 1:1 to 10:1. The vertical and horizontal axes represent the fluorescent intensity and emission wavelength, respectively. The excitation wavelength is 280 nm, whereas the Hsp90 emission peak is at 337 nm. (C) The Fmax, Kd of C086, gefitinib, and the combinations. The results represent the mean±SEM of triplicate experiments.
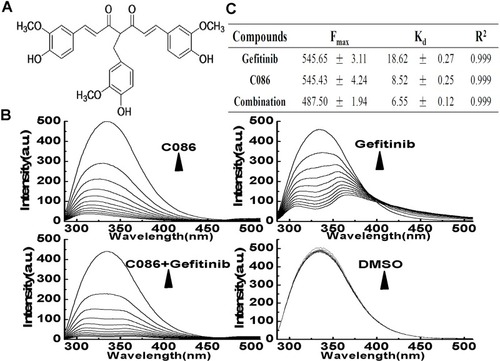
Figure 2 C086 and gefitinib as single agents or in combinations inhibit the proliferation of NSCLC cells. (A) A549 cells were treated by C086 and gefitinib as single agents or in combinations ranging from 2.5 to 10 μmol/L for 48 hrs, while NCI-H1975 cells were incubated with C086 and gefitinib as single agents or in combinations at 1.25, 2.5 and 5.0 μmol/L. Cell-growth inhibition was assessed by an MTT assay. The data were shown as mean±SEM (n=3; *P<0.05). The error bars represent the SEM. (B) The synergistic inhibition of A549 and NCI-H1975 cells treated with C086, gefitinib or C086 plus gefitinib were monitored by Western blot. A549 and NCI-H1975 cells were treated with C086, gefitinib or C086 plus gefitinib at 5.0 and 2.5 μmol/L, respectively. β-actin antibody was used as loading control.
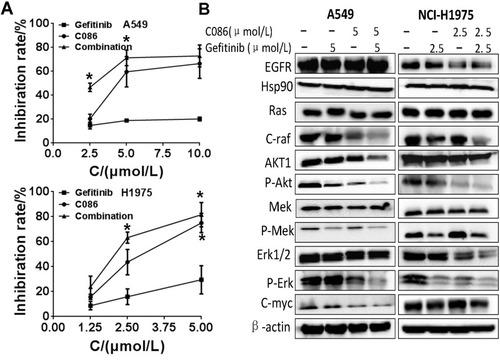
Figure 3 C086 and gefitinib as single agents or in combinations inhibits the growth of A549 and NCI-H1975 cells. (A) A549 and NCI-H1975 cells were stained with CFSE and then were treated with C086, gefitinib or C086 plus gefitinib at the indicated concentrations for 72 hrs, harvested and subsequently analyzed by flow cytometry. (B-C) C086 and gefitinib as single agents or in combinations induce cell cycle arrest in NSCLC cells. A549 and NCI-H1975 cells were treated with C086, gefitinib or C086 plus gefitinib at the indicated concentrations for 24 hrs, harvested and fixed with 70% ethanol overnight at −20°C, harvested, stained with PI and subsequently analyzed by flow cytometry. *P<0.05,**P<0.01,***P<0.001 vs. control.
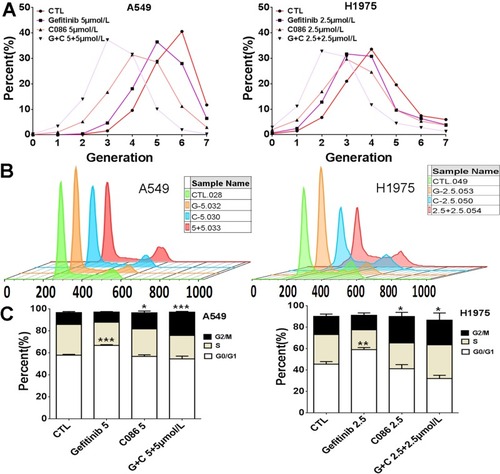
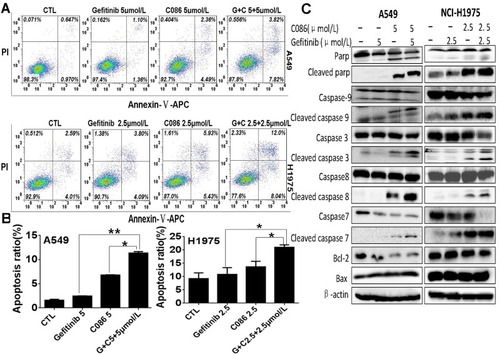
Figure 4 Effect of C086 and gefitinib as single agents or in combinations on the induction of apoptosis in NSCLC cells. (A) A549 and NCI-H1975 cells were cultured in the presence of gefitinib, C086 or gefitinib plus C086 at the indicated concentrations for 48 hrs, harvested, double stained with Annexin-V-APC and PI and subsequently analyzed by a flow cytometer. Quantification of apoptotic staining is indicated for each condition. (B) Significant differences between gefitinib, C086 and gefitinib plus C086 treatment groups are indicated. The results represent the mean±SEM of triplicate experiments. (n=3, *P<0.05, **P<0.01). (C) The protein levels of PARP, cleaved PARP, caspase-9, cleaved caspase-9, caspase-3, cleaved caspase-3, caspase-8, cleaved caspase-8, caspase-7, cleaved caspase-7, Bcl-2 and Bax in A549 and NCI-H1975 cell lysis were determined by protein gel blot. β-actin antibody was used as loading control.